Q1 2022 Market Update

Of a Clear and Present Danger
Though I never read Tom Clancy’s best seller, I always thought the title had great pop. I think it’s appropriate for this quarter’s topic – the inverted yield curve.
In late March into the first week of April the 2-to-10-year yield curve inverted. That is, the 2-year treasury paid a higher interest rate than the 10 year treasury. There are many theories about why an inverted yield curve is a predictor of recessions in the U.S. One of the first comments you will read about it, is that it’s unusual and rare. Why would shorter term maturity U.S. treasury bonds pay a higher yield than longer dated treasuries?
This indicator has been a strikingly accurate predictor of future recessions. “Every U.S. recession in the past 60 years was preceded by a negative term spread, that is, an inverted yield curve. Furthermore, a negative term spread was always followed by an economic slowdown and, except for one time, by a recession.” states an excellent paper from San Francisco Fed’s Michael D. Bauer and Thomas M. Mertens. They continue, “A simple rule of thumb that predicts a recession within two years when the term spread is negative has correctly signaled all nine recessions since 1955 and had only one false positive, in the mid-1960s, when an inversion was followed by an economic slowdown but not an official recession. The delay between the term spread turning negative and the beginning of a recession has ranged between 6 and 24 months.”
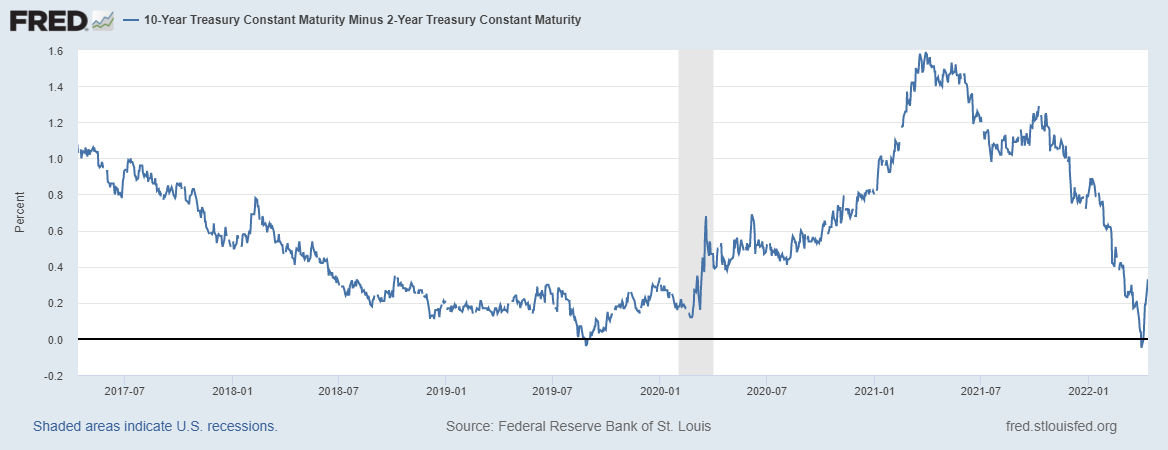
Below is a 10 year (yield) minus 2 year spread chart produced by the Federal Reserve Bank of St. Louis. It shows an inversion in August 2019, and one end of March of this year. Here’s the link should like you like to see an enlarged graphic:
https://fred.stlouisfed.org/series/T10Y2Y
Clicking the link for Max term on the same chart yields the following result, showing the 10/2 year spread since June 1976. This chart displays the yield curve inversion predicting a recession 6 out of 6 times. The shaded bars are recession periods.
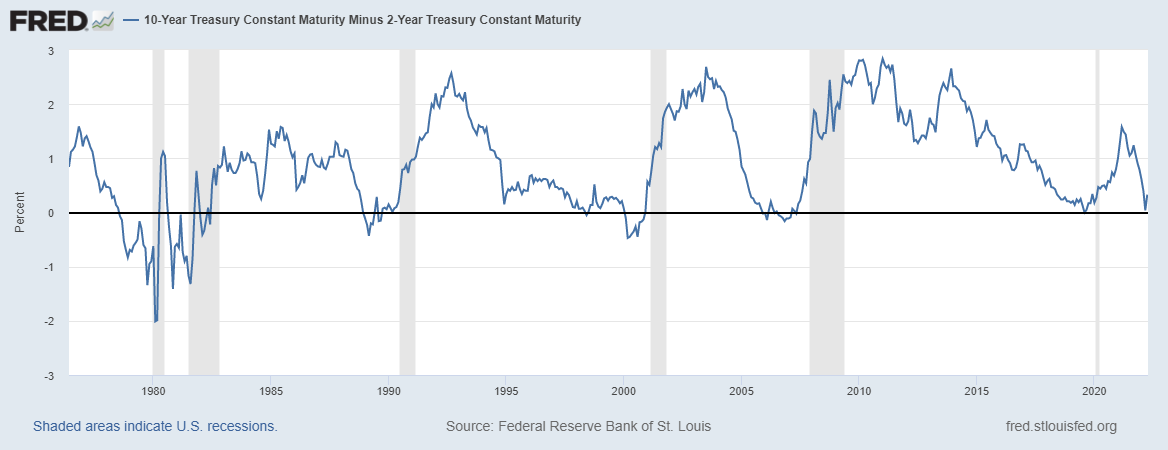
Following are recession years and the number of months the yield curve inverted prior since 1955.
Recession Year Months of Lead Recession Year Months of Lead
1957 8 1960 7
1969 24 1973 8
1980 16 1981 10
1990 17 2001 11
2007 23 2020 8
Mean: 13.2 Months
Articles in the media and on financial sites routinely tout 6 months up to 4 years for yield curve inversion/recession precedence. However, the above shows inversions average around 13 months and the window is 7 to 24 months.
“This Time It’s Different”
Despite the evidence, in every cycle there are naysayers that dismiss the yield curve inversion’s predictive powers for various reasons. Following are a few:
“I would not interpret the currently very flat yield curve as indicating a significant economic slowdown to come,” Ben Bernanke said in his first speech to Wall Street as head of the Fed in March 2006.
Federal Reserve transcripts, Mishkin Sep 2006: “I did some research on yield curves and I do not think the curve is providing much information at this time”
“Bond Market’s Recession Indicator May Not be Working this Time”
CNBC headline Article, July 10, 2018
“It’s more of a coincident indicator than a causal factor,” said Jim Caron, managing director at Morgan Stanley Investment Management. Caron said this time the yield curve could be signaling the extreme policies the Federal Reserve undertook to drag the economy out of the financial crisis.
June 28, 2018
“(Don’t Fear) The Yield Curve”
Eric Engstrom and Steven Sharpe
Federal Reserve paper in summer 2018
https://www.federalreserve.gov/econres/notes/feds-notes/dont-fear-the-yield-curve-20180628.htm
Former Fed chair Alan Greenspan famously stated that the inverted yield curve was not as good a predictor of recessions as purchases of men’s underwear.
Further Evidence
The figure below shows the term spread calculated as the difference between ten-year and one-year Treasury yields from January 1955 to February 2018, together with shaded areas for officially designated recessions
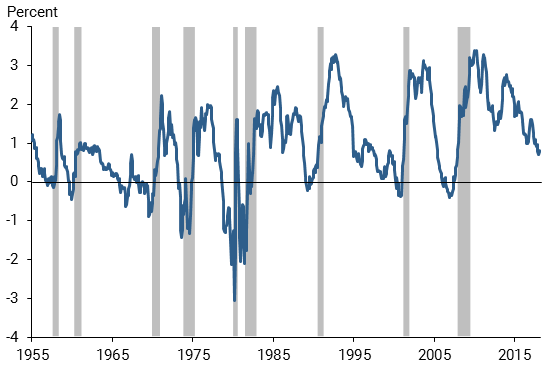
Chart Source: San Francisco Federal Reserve Bank
You can see from the chart the one false positive in 1965. That’s 9 times out of 10. I will point out though that the 1 yr. to 10 yr. curve has not inverted this time around. Neither has the 3 year to 10 year, nor the 3 month to 18 month curves. These are also closely followed time frames. Your guess is as good as mine about what that means.
We look at the yield curve from time to time by way of U.S. Treasury yields. On 03/29/22 the 2 to 10-year yield curve inverted for the first time since August 2019. We recorded it as follows:
2 year 2.43%, 3 year 2.57%, 5 year 2.54%, 10 year 2.40%,
Today (04/13/22) the yield curve slope has normalized as follows:
1 yr. 1.87%, 2 yr. 2.35%, 3 yr. 2.53%, 5 yr. 2.61%, 10 yr. 2.67%, 20 yr. 2.99%.
From 2 years on this is a fairly flat yield curve, indicative of uncertainty about future economic growth and low confidence. There have been many that argue that the Fed can manipulate the yield curve with its bond buying activities. This is true, but it has not stopped the inverted yield curve from predicting recessions.
One theory explaining yield curve inversions predictive power is that banks borrow short and lend long term. A flat or inverted yield curve hurts this equation causing credit to tighten. Now, I will say that is not the case at this point in time. Banks are flush with low-cost deposits stemming from profligate stimulus packages and increased savings following the covid crisis. Borrowing needs for banks are minimal. For verification of this, take a look at what you can earn on a 3-year treasury paying 2.53% interest with no risk, guaranteed. Compare that to your local bank offering on a CD of the same maturity at.5%.
The Fed Conundrum
Fed Chair Jerome Powell stated recently to look at the 3 month to forward 18 month yield curve for inversion clues about recessions. That’s his favorite go-to and it has not inverted.
Fed policy at this point is understandably very concerned about inflation. According to the Michigan Consumer Sentiment survey, consumer confidence is at a reading of 59.4 - the lowest since 1979/1980, even lower than during the depths of the financial crisis. Inflation is the primary cause of the rising pessimism. Year ahead inflation is expected to be 5.4%, the highest since November 1981. From the recent report, “32% of all consumers expected their overall financial position to worsen in the year ahead, the highest recorded level since the surveys started in the mid- 1940s.”
With this backdrop, the Fed has become increasingly hawkish and is communicating several possible.50% fed funds rate hikes.
Put simply, the economy may not be able to handle those rate hikes without a recession.
Recessions are Good Medicine
I like recessions. They are a natural part of the business cycle. They open up opportunities for investment. Prices become more grounded in reality. The over-levered, irresponsible players in the economy get punished. An economic recession compares to clearing out the dead wood in a river so that it can run more freely. Though we have been taught to fear them, the technical definition is nothing more than two or more consecutive quarters of declining GDP (gross domestic product). Consumer demand dries up some, and the labor market softens. In today’s case, both would help put a damper on inflation. It took a massive interest rate raise and recession in the early 80’s to tame the rampant inflation of the late 70s.
You could compare a recession to going on a diet after the holidays, or hopping on the wagon after a period of partying, or creating a household budget after a time of overspending. Pull back a bit to move forward more later.
Where Do We Go from Here? We like probabilities when we can find them. The probability of a recession has gone up significantly to.. say 60%, in my mind within the next 24 months. Our last newsletter was titled, “Large Potholes, Not Minefields,” meaning a choppy market with corrections but no recession on the horizon. I would change that title now to “Large Potholes Now, Possible Minefields Down the Road.” While our cash equivalent allocation might have been 25 to 35% prior to the yield curve inversion, we might now think it prudent to raise that percentage to 40 to 50% gradually, while changing our mix to a safer set of securities. That’s how we react to the higher probability of either a very slow economy or recession. While shorter yield curve periods have not inverted, the 2 to 10 year curve inversion is enough for me to move to higher ground over a period of time. We followed this playbook in the last half of 2019 and were ready for the Covid panic. “You can’t time the market.” True. But you can become more cautious, especially when one of the most reliable indicators around says the economy could be headed for dark waters. Periods with an inverted yield curve are reliably followed by economic slowdowns and almost always by a recession.
In our next newsletter I plan to provide some charts on housing stocks versus dollar stores which might provide further clues.
We wish you a wonderful spring.
=S Dee
All investments involve risk, including the possible loss of principal.
The comments, opinions and analyses expressed herein are for informational purposes only and should not be considered individual investment advice or recommendations to invest in any security or to adopt any investment strategy. The opinions and analysis are rendered as of publications date and may change without notice. The information provided in this material is not intended as a complete analysis of every material fact regarding any security, country, region, or market.