Q2 2020 Market Update

The Battle of Trillions
What a quarter! Markets bounced back from panic, fear and forced selling in March. Several people have asked me recently, “Why does the stock market keep doing well while the economy and employment are clearly in the dumps?”
It’s a great question which with lots of potential answers. Along with the fact that the market is forward-looking by 6 to 9 months, I’ll attempt to answer it with one word: Liquidity.
Liquidity is market and banking jargon for money of course. Specifically, though it relates to how smoothly money flows are occurring in markets. It’s like lubricating oil to an engine, when there is plenty of it sloshing around, credit markets are fluid, businesses that borrow can get loans. Credit spreads (the percentage difference between riskier bonds and riskless bonds) tighten.
The charts below show the U.S. money supply M1, M2, and M3 with commentary about each. Let’s compare the increases in the money supply to the S&P 500 index and gold prices. Then let’s look at the incredible amounts of liquidity injection by the Federal government.
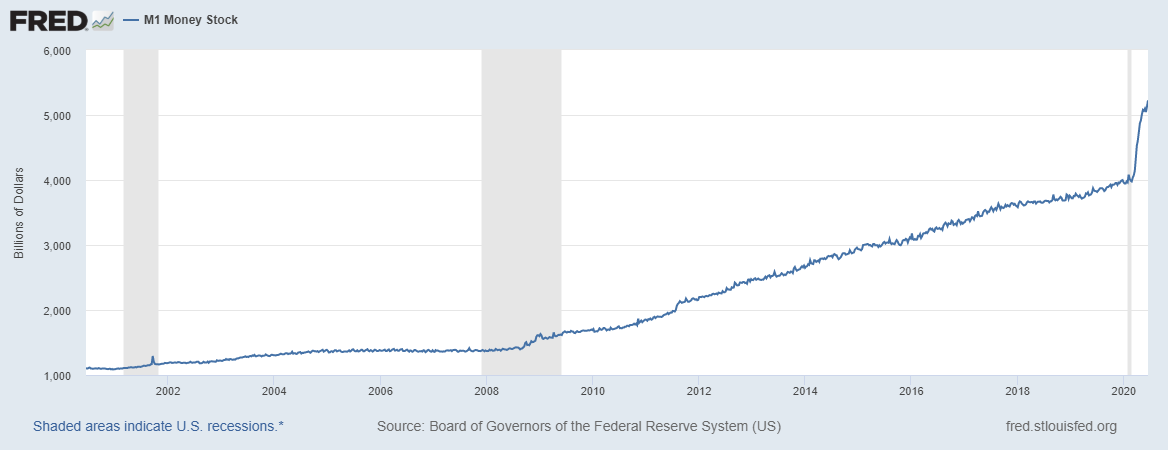
Federal Reserve M1 Money Supply 20 Years Chart
The M1 money supply has recently increased by ~32% in 2020 alone and is now above $5T. The M1 money supply consists of money that is readily accessible for spending such as money market accounts, checking accounts, and physical currency. It does not include CDs, and Treasury bills and bonds. Significant increases in M1 can be inflationary. Over the past 20 years M1 has increased by 374%.
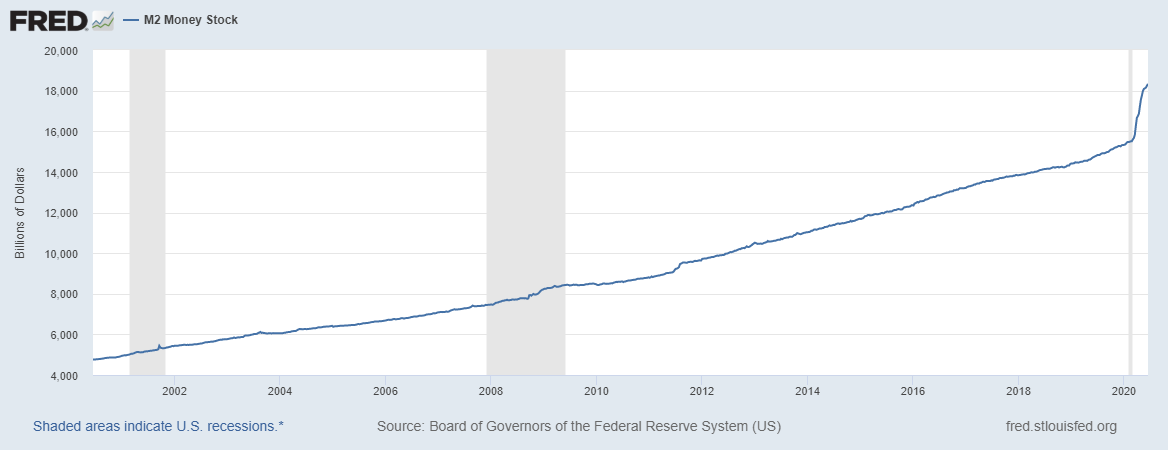
Federal Reserve M2 Money Supply 20 Years Chart
M2 is the most widely used indicator of money supply. The M2 money supply has increased nearly $3T by 19% in 2020, and by 285% over the past 20 years. M2 includes M1 plus savings deposits, and CDs under $100K.
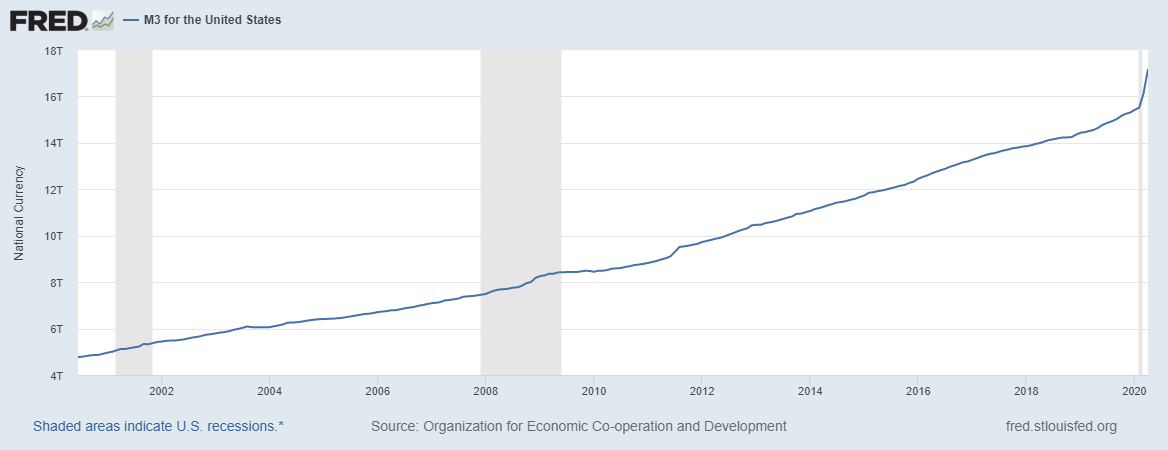
Federal Reserve M3 Money Supply 20 Years Chart
The M3 money supply has increased 12% in 2020 through April and 259% over the past 20 years. It includes the M2 supply plus large CDs, institutional money markets, short term repo agreements, and larger liquid assets like Treasuries.
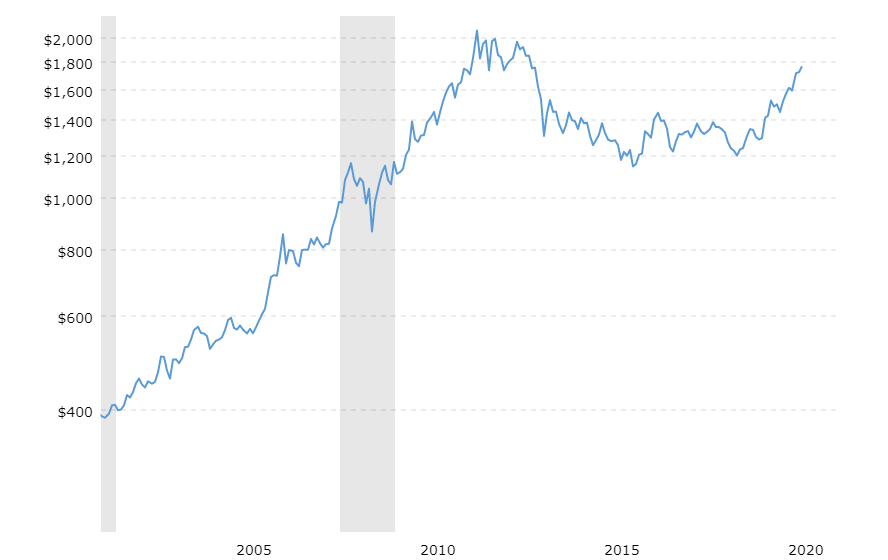
20 Year Gold Price Chart
Now let’s look at gold in comparison. The above chart shows the price of gold which many consider hard currency and a dollar substitute. Gold has increased in price 12.5% in 2020 and 355% over the past 20 years. However, the gold price is up 383% over the past 30 years while the M2 money supply has increased 470%. The U.S. has by far the largest holding of government held gold with 76% of the world’s governmental reserves. In total we have 261.5m ounces. At a recent price of $1700 that equates to $444B in market value.
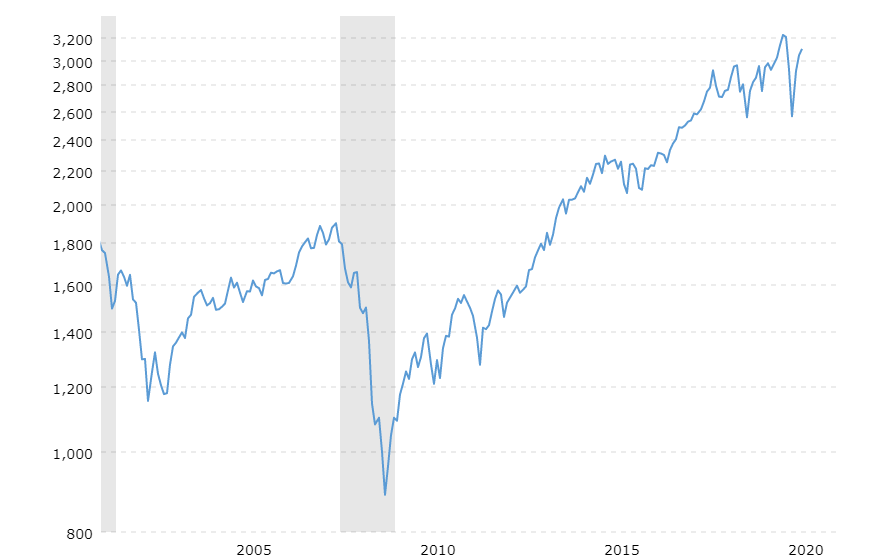
S&P 500 Index 20 Year Price Chart (without dividends) The S&P 500 index without considering dividends is the best way to compare it to the money supply in my opinion, but I’ll include both the index price and the total return with dividends reinvested to get a full picture. The S&P 500 index is down 3.4% thus far in 2020 and is up 153% over the past 20 years. With dividends reinvested the return increases to 211%. Since the S&P was at a major top in early 2000, let’s use 936 on the S&P which was the level in November 2002 and an approximate average from 2000 to 2002. From that level the S&P 500 index has risen 231% or 383% with dividends reinvested. What I’m pointing out here is that, somewhat amazingly, the S&P 500 price index has not kept up with the M2 money supply over 20 years.
The market capitalization of the entire S&P 500 index of the largest companies traded on U.S. stock exchanges is currently $25.4T. At the end of March 2020 the market cap after the tumultuous drop was $21.4T. There was $4T shed from January to the end of March and nearly $4T gained since the end of March.
Yes, The Global Economic News Looks Bad
Economists in India are predicting a full-year contraction in India’s GDP after Prime Minister Narendra Modi extended a 21-day lockdown to 40 days. The Indian economy last contracted in 1980.
The IMF is worried about the global economy. In particular, IMF Chief Economist Gita Gopinah warned, “The cumulative loss in global GDP this year and next could be about $9 trillion — bigger than the economies of Japan and Germany combined.”
The Chinese economy contracted in the 2nd quarter for the first year over year contraction since records have been kept.
In the U.S., 20 million jobs were shed over March and April or a 7th of the workforce – impacts from the lockdown associated with the spread of SARS-COV-2 and its related disease. GDP is projected to have fallen up to 17% over the first two quarters, before rebounding some in the 3rd and 4thquarter.
The Federal Reserve Bank predicts this will be, or is already, the worst economic downturn since World War II.
But…U.S. Government Fiscal, and Federal Reserve Monetary
Stimulus
Now let’s take a look at the extraordinary stimulus measures the government has taken. On the fiscal side, The Cares Act with its recent increase in forgivable loans from the Payroll Protection Plan is up to around $2.5T. On the monetary side, Jerome Powell and the League of
Extraordinary Bankers at the Federal Reserve have increased the Fed’s balance sheet from $4.1 Trillion to $7.1 Trillion. They’ve been buying mortgage backed securities and corporate debt among other things. That’s an astonishing 73% increase in the Feds holdings. So all totaled, we can put a number on the record stimulus of around $5.5 Trillion!!!
To put that amount in perspective, that’s around the same amount as the UK and France’s entire GDP combined for a year. Think about the massive record-setting and hotly-contested financial crisis bailout package (TARP) of 2008. It was originally estimated to cost $700B, however the total injection ended up at $426B and the government recovered $441B from the banks, for a cool $15B profit to the taxpayer. This time around the American taxpayer or the U.S. dollar (through inflation) or both will be left holding the bag.
$5.5 Trillion is more than all U.S. federal tax receipts in 2019 which totaled $3.4T. That last little add-on to the Cares Act that went to small business disaster relief and Payroll Protection of $400B is almost as much as the entire U.S. government gold reserve.
The Bottom Line
All this is to say, the amount of money that has been pumped into the accounts of Americans and American businesses is staggering. Meanwhile the savings rate has skyrocketed due to lockdowns. There is enormous potential for explosive spending to rebound GDP in the back half of 2020 and first half of 2021 when Covid 19 decamps. The stock market has been a beneficiary of the extreme liquidity infusion. And with the Fed Funds interest rate at 0-25 basis points, TINA (there is no alternative but the stock market) is back. If it becomes apparent that the battle against Covid is failing, and we’re in for a longer fight, the market will likely adjust from its current V-shaped recovery forecast. Wearing masks should help prevent more lockdowns and put the economic recovery on a better trajectory.
Onward and Upward in 2020!
=SD
.