Q2 2022 Market Update

The QT Conundrum
Though I’m a big fan of the fountain area, hot dog choices and consistently market-beating gas prices at Quick Trip, that’s not the QT we’re referring to in this market update. Instead, it’s a rare and potentially impossible condition known as quantitative tightening.
Recent Federal Reserve Bank (Fed) minutes have mentioned QT as a probable inflation remedy in addition to raising interest rates. This will mark only the second time in history the Fed has tried it.
Let’s take a deep dive into the effects of QT on your wealth and the markets and discuss why it probably can’t happen – at least not for a significant period.
You’ve heard quantitative easing (QE) oft mentioned for the past 14 years. People commonly and correctly refer to it as money printing, except that it mostly ends up being electronic money, parked in accounts on bank balance sheets. The purpose of QE is to increase liquidity (money) in markets through more available credit to lending institutions. This occurs through the Fed creating electronic money by purchasing U.S. Treasury bonds and mortgage-backed securities. Simply, when lending institutions have more availability to easy credit, they can lend more out. QE is the opposite of QT and it really didn’t get going in earnest until the 2008 financial crisis.
Follow along on the chart below which shows the Federal Reserve Bank’s total assets since 2008. Going into the 2008 the Feds balance sheet holdings stood at around $870B. Through QE, The Fed increased its assets to 4.5B by January 2015. At that point it started slowly selling the assets. From 2017 to 2019 the Fed attempted reducing the balance sheet by around $50B per month. That effort ended at around $3.8T in balance sheet assets when the reductions caused some problems in the short-term funding markets. When the Covid/lockdown crisis hit, The Fed initiated a buying program that effectively kept financial markets from seizing up. I think most would agree that effort should have ended at the end of 2020 with assets around $7.3T. But the Fed kept buying until March of this year in the face of elevated inflation and balance sheet assets are peaking now at almost $9T.
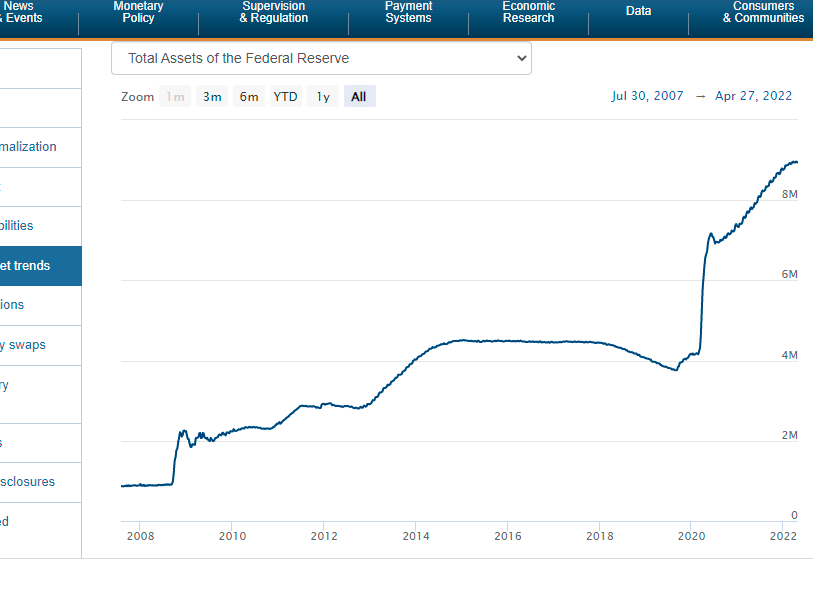
The May 4th Fed release regarding balance sheet reduction is accessed by link below:
https://www.federalreserve.gov/newsevents/pressreleases/monetary20220504b.htm
The release states that the Fed will begin QT in June by $47.5B increasing to $95B by September. At that rate it would take 4.5 years to reduce the balance sheet by the recent $4.5T expansion. While I think the Fed will initiate the program in earnest, it will be cut short within the next couple of years.
Here’s why.
What happens to financial asset prices when the Fed engages in QT? If all asset prices (stocks, bonds, real estate, precious metals, private investment) increase in price during QE, wouldn’t they correspondingly decline during QT? Yes. Quantitative tightening will impact financial assets.
Bond and stock portfolios, 401K balances, house prices, commercial real estate, beach lots, technology startups, all off it drops in market price. House values are a backbone of Americans net worth and they will get hit. Bonds continue to lose value through interest rate increases. Savings are hit from both sides, inflation in the goods and services we consume, and declining financial asset prices. It’s a tough scenario for which I don’t believe America has the stomach without a backlash.
So I think the Feds actions will lead to a recession rather than a soft landing and they will be forced to discontinue QT and interest rate increases. There have only been 3 or 4 soft landings since 1955. A soft landing occurs when the Fed raises rates aggressively, inhibiting economic growth, without spawning an ensuing recession. 71% of the time, when the Fed raises rates aggressively, a recession follows. Historically the recession begins around 2 to 3 years after the tightening starts in earnest. The chart below shows the Fed Funds rates with the light gray vertical bars representing recessions:
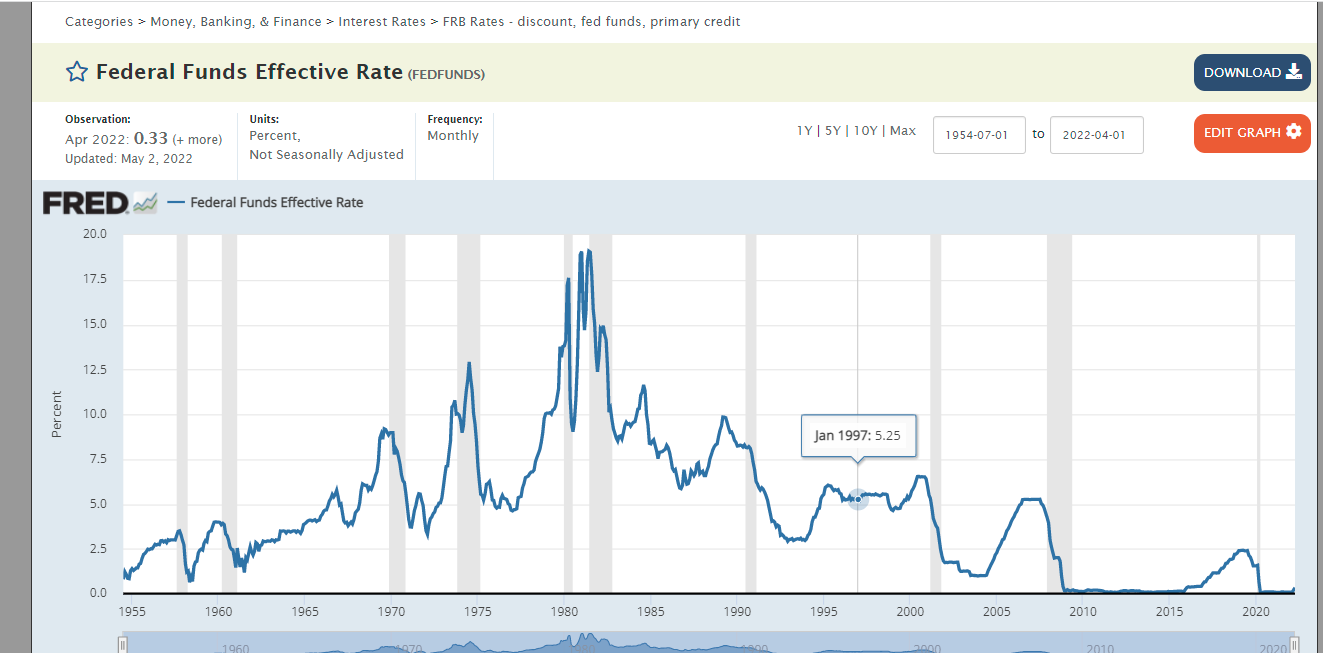
As I mentioned in last quarters market update (link below), recessions are a healthy part of the economic cycle. A recession will dampen demand and hopefully help bring prices back in line. But it’s definitely not upon us now and should be 1 to 3 years out.
Homebuilders and Dollar Stores
We mentioned in the last market update that we would show a chart of a couple of homebuilders and dollar stores. Cyclical homebuilder stock prices can be early indicators of the beginning of the end of an economic cycle as mortgage rates rise and predicted demand for homes declines. Below, the stocks of homebuilders DR Horton and MI Homes show steep recent declines. In contrast, dollar stores are recession resistant, with demand for their products at times increasing during recessions. Below, Dollar Tree and Dollar General share prices have held up well the last few months. The divergence in the stocks occurred around year end 2021 (Circled).
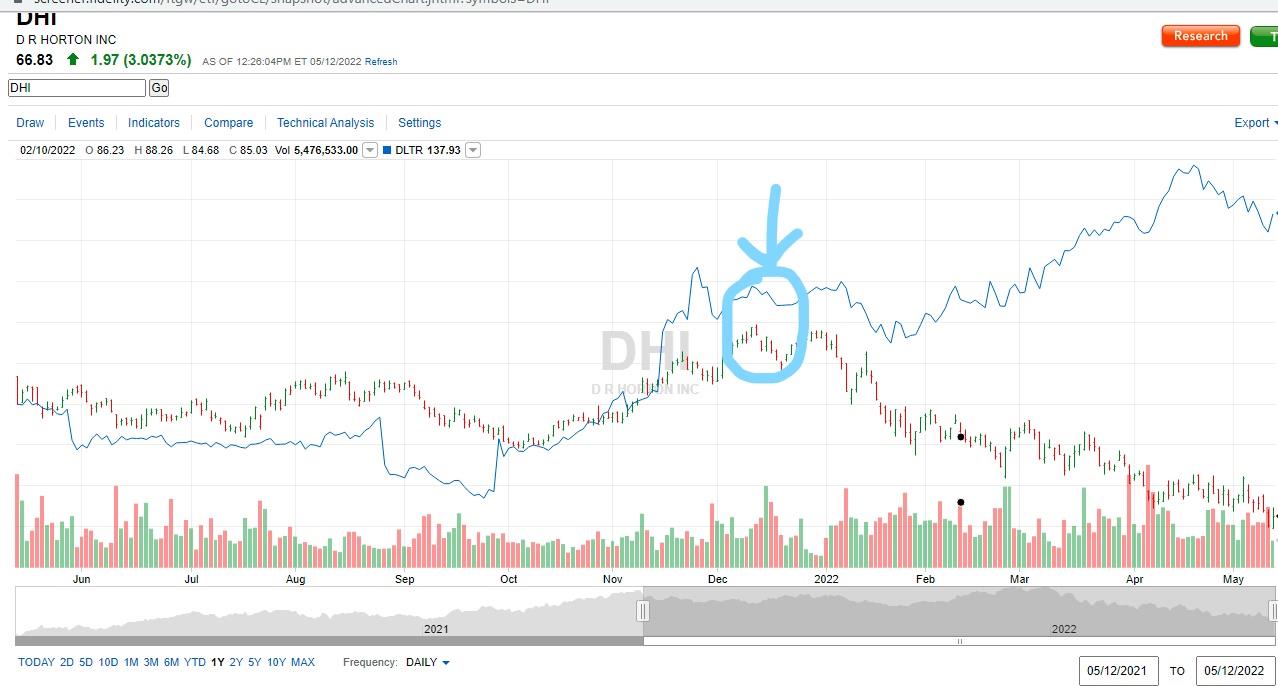
1 Year Stock Price Chart. Blue Line: Dollar Tree, up 46% vs. Red Line: DR Horton Homes down 27%.
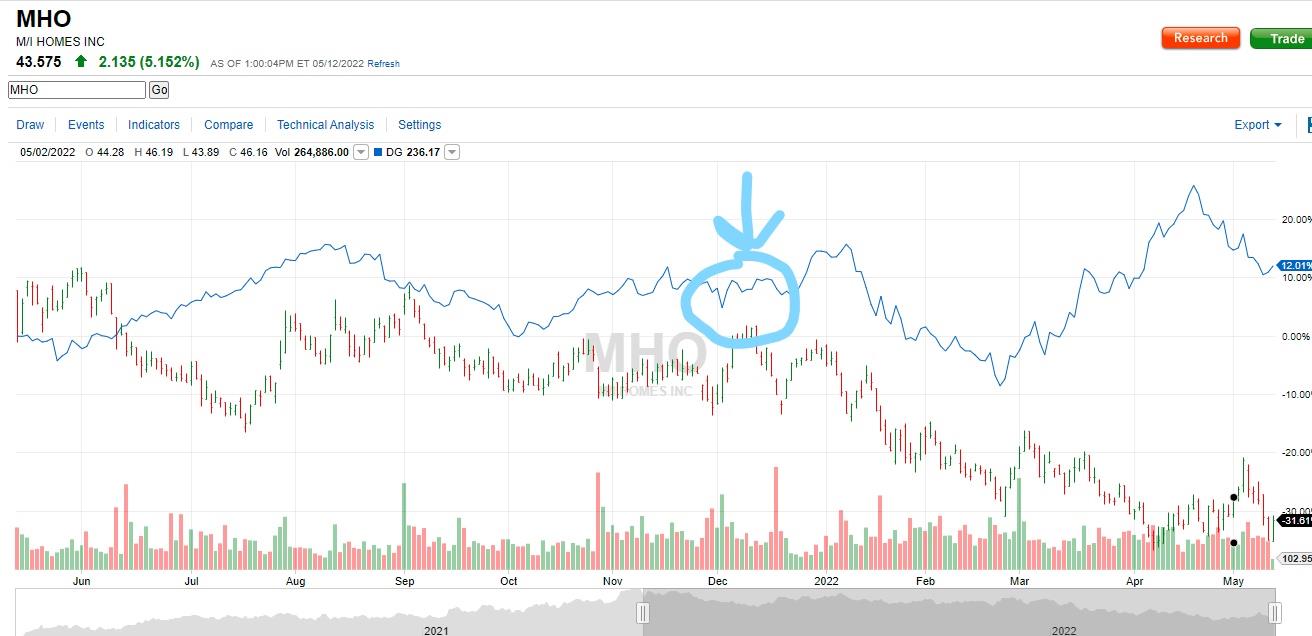
Similar to Dollar General (Blue Line) vs. M/I Homes (Red Line) below:
Summary
The Fed, with all its resources, was dead wrong about inflation being transitory post Covid crisis. Now, its pinned by inflation CPI of over 8% year over year, a somewhat unwilling workforce, its past actions regarding ZIRP (zero interest rate policy), and global supply chain problems. It’s forced to raise rates to fight inflation in the face of low projected growth estimates for next year. This spells stagflation and a likely future recession.
Our Strategy in Times like These
It’s not market volatility but instead the combination of an significantly overvalued market (even after the 19% drop) combined with rising interest rates and QT that create in us a desire to hold plenty of dry powder. The percentage varies, but we could hold as much as 30 to 50% cash equivalents in this environment. Turbulence resulting from Fed interest rate hikes and QT causes dislocations in the prices of many equities and assets. Temporary dislocations can present long-term opportunities and you’ll need those cannon balls and accompanying powder when it does.
Aside from holding cash equivalents, a strategy we recommend is to establish a recession buy list of potential stocks that you want to own at the right price. Set up price triggers at a “no brainer” cash flow or earnings multiple and be ready to pounce. Be willing to own it long term and buy more if the price declines further. Choose carefully and wisely for the long term and keep up with the fundamentals of the business. There exists continual over-reaction to the upside and downside during economic cycles. Wait til you see whites of their eyes, and light the fuse.
We wish you a wonderful summer.
=S Dee
All investments involve risk, including the possible loss of principal.
The comments, opinions and analyses expressed herein are for informational purposes only and should not be considered individual investment advice or recommendations to invest in any security or to adopt any investment strategy. The opinions and analysis are rendered as of publications date and may change without notice. The information provided in this material is not intended as a complete analysis of every material fact regarding any security, country, region, or market.