Q2 2023 Market Update

The Pendulum Always Swings
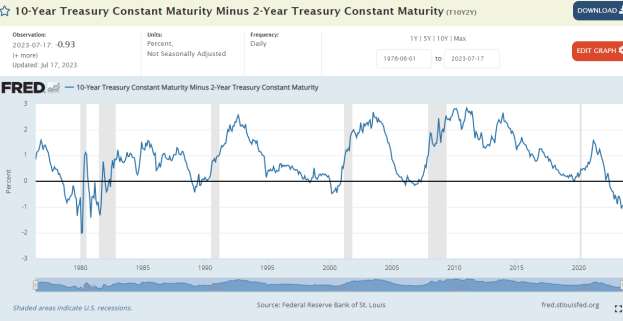
Jobs and the economy look strong. Hourly wages rose another.4% in June. The economy is expected to have grown 1.1% in Q2. 80% of economists and top strategists predicted a recession would be here by summer. The crowd is usually wrong – at least on the timing. Still, the 2 to 10-year yield curve remains stubbornly inverted. While rates have been going up and down this year, the 10year minus 2-year yield spread has remained at a very deep 1%, portending a recession in the future. Maybe it will be delayed until 2024 or 2025? Who knows.Nobody.
Peter Lynch once quipped that if you spend 13 minutes on the economy, you’ve wasted 10 minutes. So with that, we’ll provide the 2 to 10-year spread chart below for your perusal and move on. Note: The shaded gray vertical bars are recessions. When the blue line dips below the 0% black line, there is an inversion which usually precedes a recession.
The Nifty Fifty and the Magnificent 7 Ever heard of the Nifty Fifty? These popular blue chip growth stocks of the early 1970’s enjoyed a huge run. The group included high quality stocks such as CocaCola, Proctor & Gamble, Walt Disney, and Pfizer. They exhibited consistent growth and solid dividend characteristics. As they gained popularity, sentiment turned overly positive to, “you can’t lose investing in these types of equities.” That was true over the very long term. However, at their peak in late 1972, they traded at a price/earnings (P/E) ratio of 42X while the overall S&P 500 traded at 19X. During the 1973 and 1974 recession, they corrected, and underperformed the broader indexes sharply at first, but also over the next decade. Who wants to underperform for a decade?
During the 1999 tech bubble stocks like Cisco led the charge, trading all the way to 29X sales. Now that’s juicy! Akamai, Global Crossing, Lucent, Nokia, Microsoft and Intel were some of the big tech bubble stocks, to name a few.
There is likely a comparison today with the Magnificent 7 attracting investment dollars by the trillions. Apple, Microsoft, Google, Nvidia, Meta, Tesla, and Amazon make up the group, carrying the S&P 500 higher in 2023, accounting for 60% to 70% of the index gains. These 7 stocks account for a combined $11.34T of the S&P 500 Index’s $37.5T as of this writing. They are likely in for a period of underperformance when the AI boom ends and will take the S&P 500 index ETFs with them. (Note: We are only 6 months into the AI boom, so the rally in AI could extend another year or more.)
Let’s take a look at a couple of valuation comparisons. First we’ll look at Microsoft vs. Elevance Health (ELV). Elevance Health is better known as Blue Cross Blue Shield, a boring health insurance company.
Both companies have exhibited comparable long-term growth in earnings and free cash flow over the past 20 years. Charts below:
MSFT – 20 Year Diluted Earnings Chart
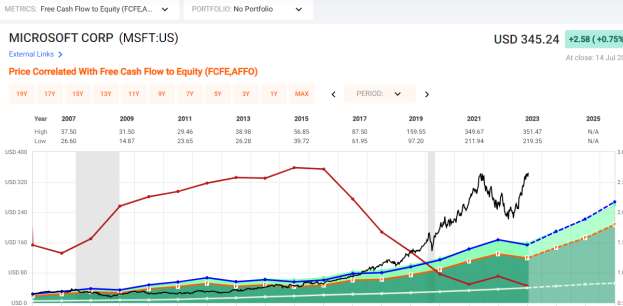
The filled green area in the chart is diluted earnings, which shows substantial growth over 20 years. However, as can easily be seen, the stock price (black line) has been growing much faster than earnings. The blue line is the normal P/E ratio for Microsoft. Notice how elevated the stock price is above the blue line. A stock should typically trade close to the earnings line (green fill) over time. Over the past 10 years, Microsoft has grown Free Cash Flow by 10% per year on average, while the stock has risen 27% annually over the period. Stocks are normally considered fairly priced when earnings growth % and the P/E ratio for the company are equal. So what this chart is showing us is that Microsoft’s stock price has been driven more by sentiment than by earning growth.
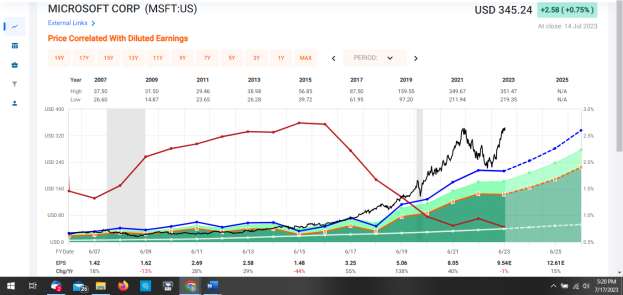
MSFT: Current P/E Ratio: 36 Earnings Growth Rate: 13.4% It’s trading at nearly 3X fair value.
The following Free Cash Flow picture is even more bloated with MSFT trading at 43x FCF with a 12% growth rate:
Let’s look at Elevance.
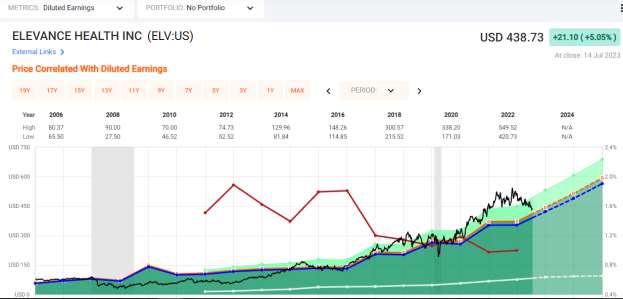
This first chart shows the stock price (black line) nearly in line with its 20 year average (blue line).
P/E Ratio: 16X Diluted Earnings Growth Rate: 12.2X
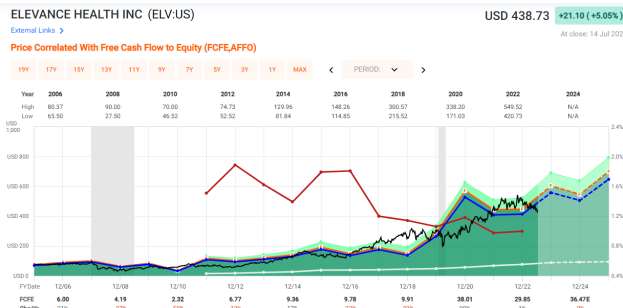
Now let’s look at Free Cash Flow:
Price/Free Cash Flow Ratio = 12.4X Free Cash Flow Growth Rate: 11.8X.
An easier way to express the comparison is yield. Elevance has a free cash flow yield of 8% while Microsoft’s is 2.3%. They have comparable growth.
Nvidia vs. Global Payments Inc. (11 Years Comparison)
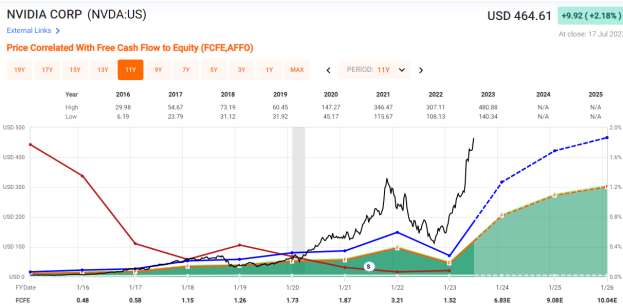
Let’s take a look at these two on a free cash flow comparison.
NVDA: Price/Free Cash Flow 117X FCF Growth: 35% avg. per year including some lofty numbers in 2024/2025 (lighter green area).
If Nvidia can keep that 35% growth going for another 10 years, that 117X price tag will be justified. But talk about execution risk!
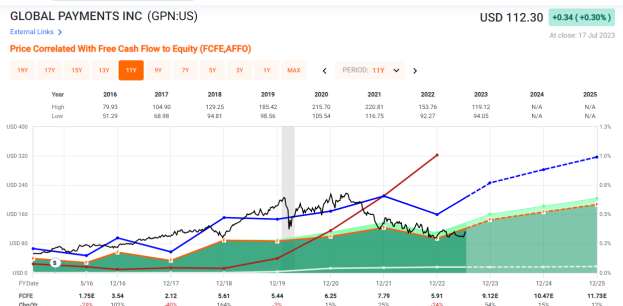
Now, Global Payments Inc.
GPN: Price/Free Cash Flow 14.6X FCF Growth Rate: 15.8%. The stock is
trading at a good price equal to its growth rate and well below its past average valuation.
Conclusion
The S&P is trading 25% expensive on forward one -year earnings estimates to its historical average. 80% of top Wall Street sell side economists and strategists predicted we would be in a recession by now. But the economy remains solid. The predictions were probably early. All weather stocks that become defensive in a recession are gaining our attention here as are mid-cap and small-cap value and growth, which are comparatively cheap.
It’s counter-intuitive, but historically the time to reduce risk is when the Fed starts cutting rates. For the very near term, that looks to be impossible, with a projected hike later this month and again in September. The overall market usually keeps rising as long as the Fed is raising rates.
When the 10-year treasury rises above 4% again, we plan to add duration to protect against future Fed rate cuts.
“The market is a pendulum that forever swings between unsustainable optimism (which makes stocks too expensive) and unjustified pessimism (which makes them too cheap). The Intelligent Investor is a realist who sells to optimists and buys from pessimists.” -Benjamin Graham, The Intelligent Investor
Thanks for reading. Stay tuned for our Q3 market update entitled, “This is What Always Happens.”
All investments involve risk, including the possible loss of principal.
The comments, opinions and analyses expressed herein are for informational purposes only and should not be considered individual investment advice or recommendations to invest in any security or to adopt any investment strategy. The opinions and analysis are rendered as of publications date and may change without notice. The information provided in this material is not intended as a complete analysis of every material fact regarding any security, country, region, or market.