Q2 2024 Market Update

Simple Numbers, Complicated Implications
The S&P 500 trades at around 21X 2024 earnings vs. a long-term average for the market over the last 50 years of around 16X.
By comparison, during the Dotcom Bubble, S&P 500 valuations hit 24.4X forward earnings in July 1999.
Growth and Size have been the big determining factors for winners in the latest cycle vs. for example Value, Mid-cap, or “Dividend Stocks.”
The S&P 493 sans the Magnificent 7 trades at a very reasonable 15.5X forward earnings. The Magnificent 7 trades at around 35X forward earnings. There are assuredly many great compounders in that 493 that are trading at very reasonable valuations.
Perhaps the purer measure of market valuation is the Price to Sales ratio. The Price/Sales ratio for the S&P 500 is 2.97X with the normal range being 1.8X to 2.6X and an all-time high of 3.17X.
The Dow Jones Industrial Average was first calculated in 1896, although stocks had already been trading for over 100 years.
Apple was the first U.S. company to reach $1 Trillion in Market Cap in 2018. It took 122 years (from Dow formation) for a stock to reach this valuation.
Nvidia’s market cap increased from $2 Trillion to $3 Trillion in….one month.
Implications: All that capital being pumped into the Mag 7 must come from somewhere. Much of it has been pulled from other worthy stocks in the market leaving categories such as value, small-caps, mid-caps, and “dividend” stocks at very reasonable or even cheap valuations.
Historically, dividend stocks, REITS, bonds, and preferred stocks outperform during falling interest rates scenarios.
“Skate to where the puck is going, not where it’s been.” -Gretsky
Magnificent 7 Valuation and Comparisons
Following are 7 stocks with reasonable valuations in earnings and free cash flow that might be considered as an alternative to the Mag 7.
10 yr Price / 10 yr FCF P/E Growth Rate FCF Growth Rate
Magnificent 7 Microsoft 37 22% 47 14.40%
Interesting
Paycom 20.8 34.60% 30 30%Alternative
Paycom is a payroll software company with recurring revenue.
10 yr Growth Price / 10 yr FCF P/E Rate FCF Growth Rate
Magnificent 7 Alphabet 26.2 22% 30 22%
Interesting
Alternative Opera 14.8 44.2% 10.3 43.3%
Opera is a gaming web browser with a forward growth rate of 15 to 20%.
10 yr Growth Price / 10 yr FCF P/E Rate FCF Growth Rate
Magnificent 7 Amazon 48 57% 40.6 24.9%
Interesting
Alternative TD Synnex 15 14.7% 8.5 19.1%
TD Synnex is a technology products distributor with impressive FCF growth over time.
10 yr Growth Price / 10 yr FCF P/E Rate FCF Growth Rate
Magnificent 7 Apple 34.4 12% 32.7 9.8%
Interesting Global
Alternative Payments 9.1 16.7% 12 14.1%
Global Payments is a global payments processor.
10 yr Growth Price / 10 yr FCF P/E Rate FCF Growth Rate
Magnificent 7 Nvidia 66 62% 72 52%
Interesting
Alternative First Solar 19.5 15.2% - -%
First Solar is a solar panel manufacturer with impressive growth on the horizon.
10 yr Growth Price / 10 yr FCF P/E Rate FCF Growth Rate
Magnificent 7 Meta 26.7 33.6% 27.6 24.8%
Interesting Elevance
Alternative Health 16.5 17.2% 16.9 16.1%
Elevance Health is a health insurer with brands like Blue Cross Blue Shield. If Meta can maintain its growth rate, it’s the most reasonably valued of the Mag 7.
10 yr PE Price / 10 yr FCF P/E Growth Rate FCF Growth Rate
Magnificent 7 Tesla 80 23% 300 12.3%
Interesting Enterprise
Alternative Product Partners 11.4 8.7% 14.8 17.4%
Enterprise Product Partners has had impressive free cash flow growth. It’s cash flow growth is slowing some now to high single digits.
The True Inflation, Increases in Money
Since January of 2000, the money supply (M2) has increased at an average rate of 7% per year - the true inflation (10 year chart below). That’s the number investors need to match to maintain purchasing power.
The U.S. Economy Explained in 3 Charts
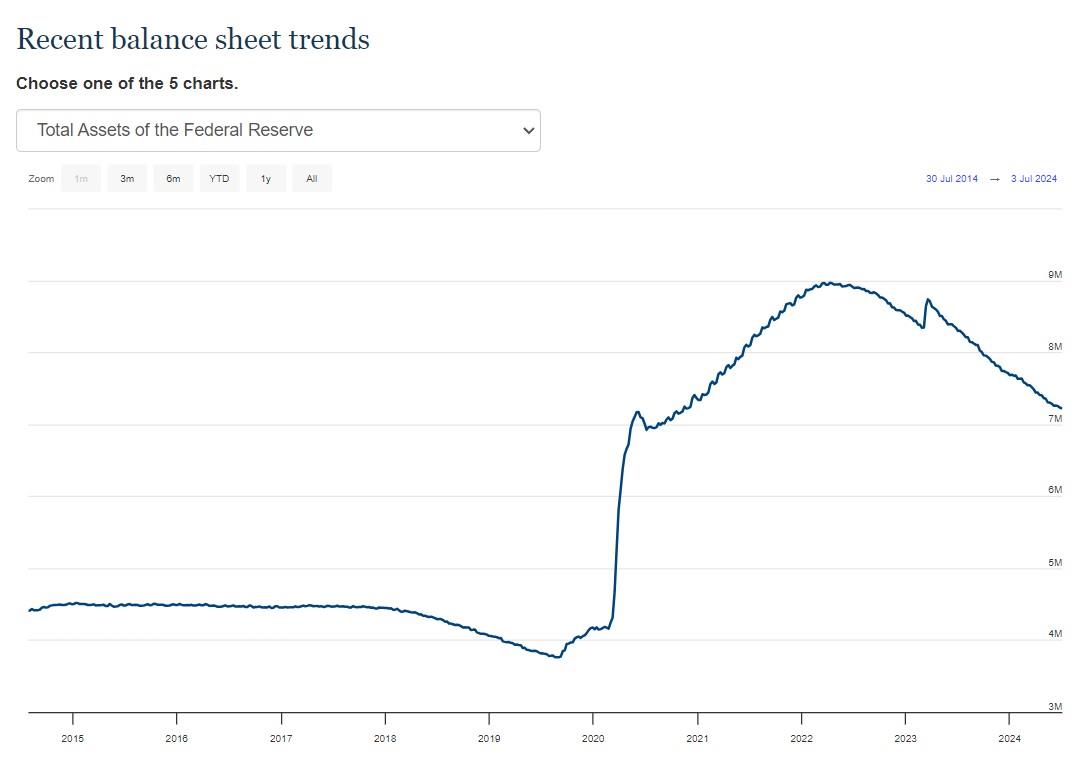
Monetary Policy: While the Federal Reserve has been reducing the money supply through QT, the Feds balance sheet is still $3 Trillion and 75% larger than pre-covid. Despite the headlines, this is a very accommodative monetary policy.
Federal Reserve Balance Sheet 10 Year Chart. Currently at $7.2T up from $4.1T pre-covid.
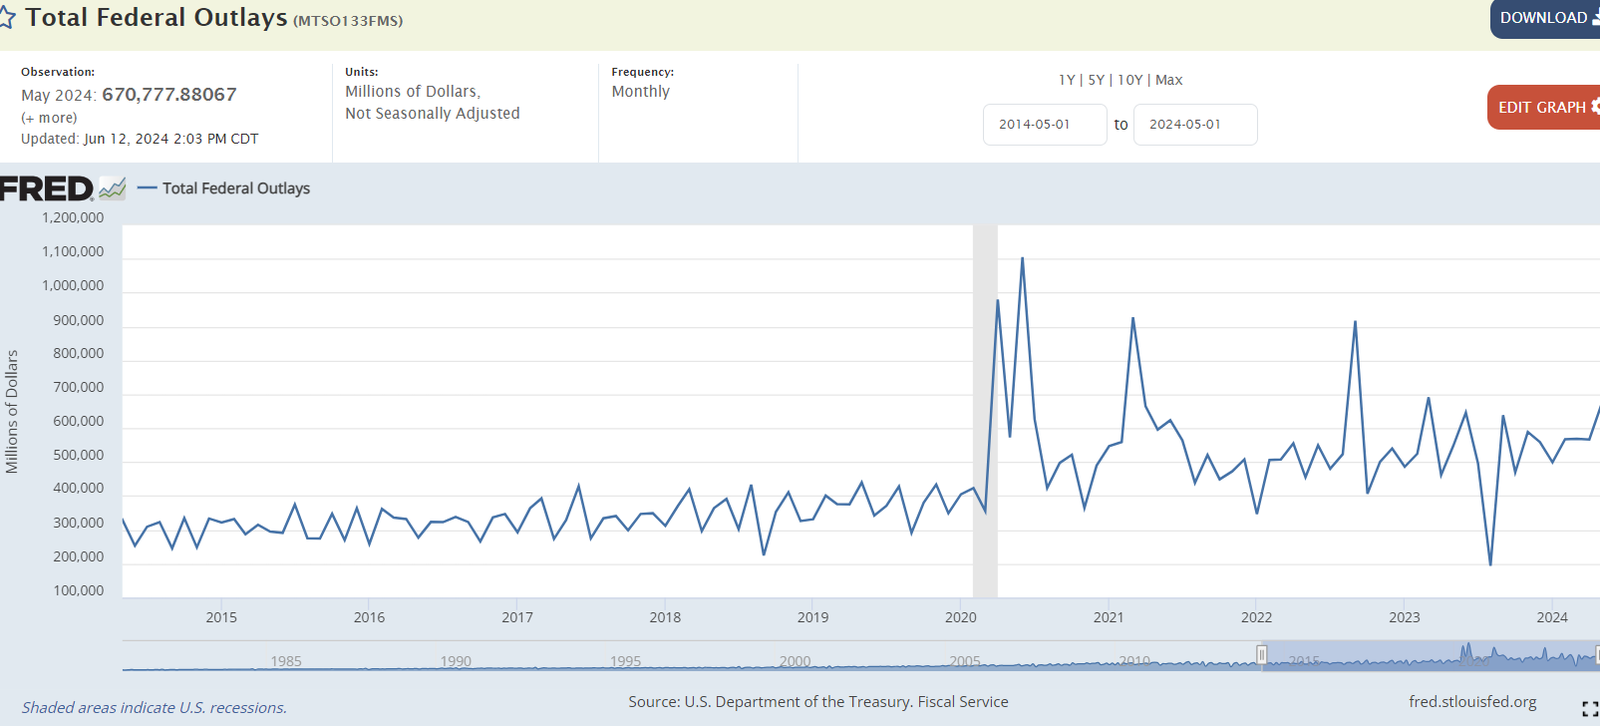
Fiscal Policy: At the same time Federal Outlays have exploded higher, more than doubling over the last 10 years. Post-covid, the U.S. government has had several enormous spikes in spending as evidenced by the chart below.
Federal Reserve Bank, Federal Government Outlays 10 Year Chart
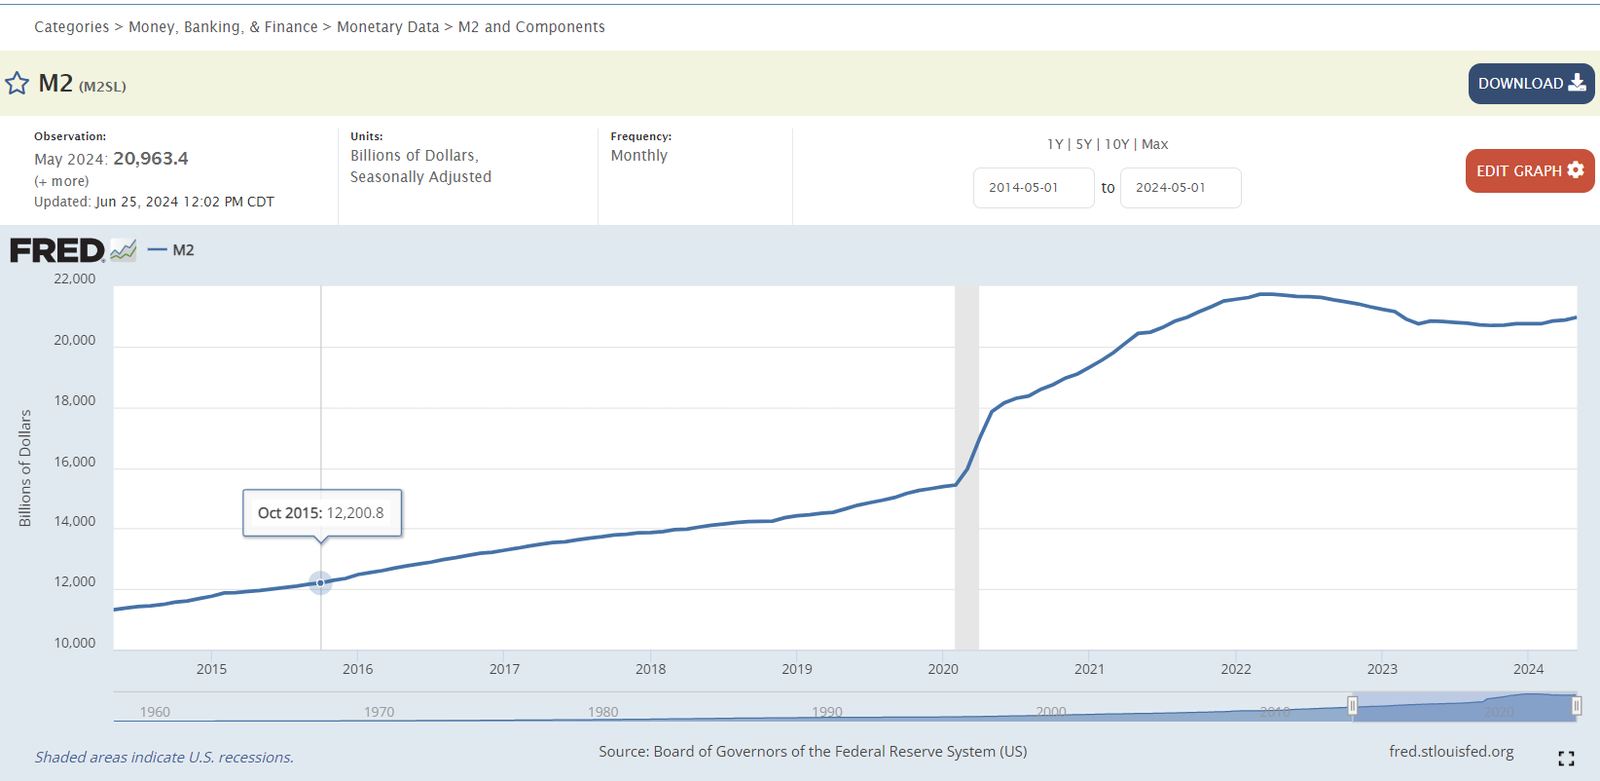
Money Supply: The increase in Federal Outlays has almost completely offset the reduction in the Federal Reserve Balance Sheet, resulting in a near peak postcovid M2 money supply. There is 36% more money in the economy than precovid and an increase of 86% over the past 10 years.
Federal Reserve Bank, M2 Money Supply 10 Year Chart
Summary
Valuation becomes more important in a declining interest rate environment. Stocks with lower P/E and P/FCF ratios and higher dividends become more attractive than high P/E stocks.
Maybe we will enter a period called, “the great rotation,” out of Mag 7 stocks into the rest of the market (particularly value). After all, there is trillions of dollars in the Mag 7 stocks – 30% of the S&P 500. It wouldn’t take much.
The U.S. (and to some extent world) economy has been floated by huge government deficits equaling 6 to 7% of GDP, which have offset modest Federal Balance Sheet tightening to keep the money supply elevated well above trend.
With our savings, net worth and purchasing power being depleted at an average 7% per year, the following advice is sanguine:
“The arithmetic makes it plain that inflation is a far more devastating tax than anything that has been enacted by our legislatures. The inflation tax has a fantastic ability to simply consume capital.” Warren Buffett
With that sage advice, we’ll wrap up. We wish you all the best in whatever endeavor you are enjoying this summer. Happy investing!
All investments involve risk, including the possible loss of principal.
The comments, opinions and analyses expressed herein are for informational purposes only and should not be considered individual investment advice or recommendations to invest in any security or to adopt any investment strategy. The opinions and analysis are rendered as of publications date and may change without notice. The information provided in this material is not intended as a complete analysis of every material fact regarding any security, country, region, or market.