Q2 2026 Market Update

1999 Internet Bubble vs. Today's AI Boom: Parallels, Differences, and Lessons
There is lots of talk in the financial world these days about the AI Bubble. We decided to do a deep dive to compare the AI boom to the late 90’s Internet boom and bubble. I remember it well. Cisco, eToys, Yahoo!, and AOL were market darlings. And Juniper Networks came out with a well-timed IPO in June 1999 that quickly gave it a valuation of over 100X revenue despite no profitability.
I was reading an article in the Wall Street Journal in late 1999 about an online e-commerce clothing company named Boo.com, which I kept as I had my own (profitable) e-commerce company at the time. It struck me when I read that the company raised a couple hundred million dollars in pre-IPO funding in short order from a blue-chip investor list: JP Morgan, Goldman Sachs, LVMH's etc… Then the company valuation rose to $390m – all without profitability and scarcely any sales. The CEO jaunted back and forth from New York to London offices in a Concorde while hiring 400 employees. The company burned through $10m a month in losses while spending $25m in marketing before the website even launched. Shortly after the bubble started to burst, Boo failed to raise another round of funding and collapsed. Somehow the world survived without it.
The late 1990s dot-com bubble and the ongoing AI-driven market rally share striking surface similarities: explosive enthusiasm for transformative technology, soaring valuations in tech-heavy indices, and a sense that "this time it's different." Yet a closer look at key metrics—IPOs, valuations, earnings, profitability, and revenue multiples—reveals important differences. The 1999 bubble was characterized by hype around unproven business models with minimal revenues or profits. Today's AI cycle features real earnings, massive cash flows from leaders, and more selective public debuts, though risks like concentration, capex intensity, and high expectations remain.
IPO Mania: Quantity vs. Quality
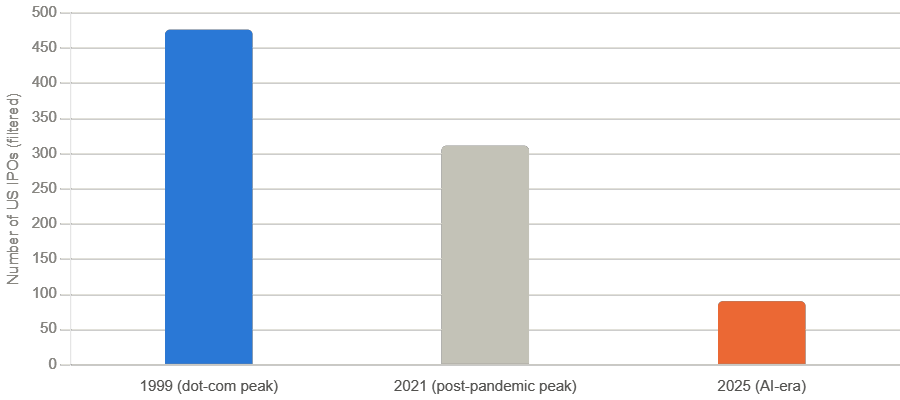
In 1999, the U.S. saw a frenzy of IPOs, with roughly 477–547 tech/internet companies going public (part of ~547 total IPOs that year). Many were tiny, pre-revenue or low-revenue firms hyped on "eyeballs" and future potential. Average first-day pops were massive (~65%), but outcomes were brutal: ~74% of tech IPOs were unprofitable at listing, and roughly 50% of the 1999 cohort failed (bankrupt, delisted, or distressed sales) within years.
Contrast with 2024–2026: Far fewer IPOs (50–80 tech per year), but higher quality. Median ARR at listing is $300M+, with ~40–55% profitable or near-breakeven (vs. ~26% in 1999). Companies like Reddit or Klarna came with real revenues and paths to profitability. The pipeline includes mega-names (e.g., SpaceX), but overall activity is subdued compared to the dot-com peak or 2021 SPAC wave.
Key takeaway: 1999 was a volume-driven speculative flood; today's market demands scale and traction before going public.
Perhaps a Warning Sign – Price/Sales Ratio
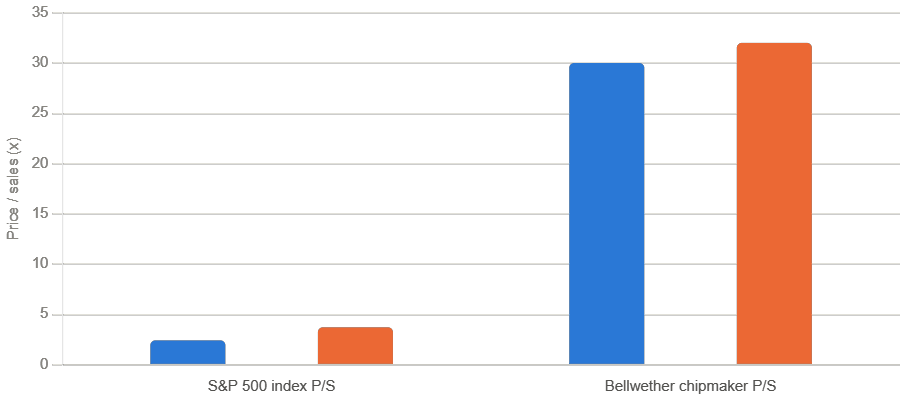
Red - Today
On a broad-market basis, the two eras look surprisingly close on price-to-sales — and today is actually a bit richer. The S&P 500's price-to-sales ratio peaked around 2.4 in 2000, well above the long-run average near 1.5–1.8. Today it's running around 3.7, a level near the all-time record, which means the current AI-driven market is paying more per dollar of revenue, in aggregate, than investors did at the dot-com peak.
The picture flips, though, when you drill into the era's flagship stock. Cisco, the networking bellwether of the dot-com years, traded at a trailing P/E as high as 472x in 1999 and carried a price-to-sales multiple in the same rarefied territory, despite generating relatively tame net margins of just 17.25% in 1999. Today's bellwether, Nvidia, trades at a price-to-sales ratio that has temporarily exceeded 30, similarly stretched in isolation — but it's backed by margins just north of 50% and roughly $215.9 billion in FY2026 revenue. So the single-stock multiples rhyme, but the earnings quality underneath them doesn't: 1999's Cisco was priced for a story, while today's chip leaders are priced on genuinely enormous, highly profitable revenue.
A few caveats worth keeping in mind: P/S ratios say nothing about profitability or debt, so they're a blunt instrument on their own.
Price to Earnings Look More Reasonable Today
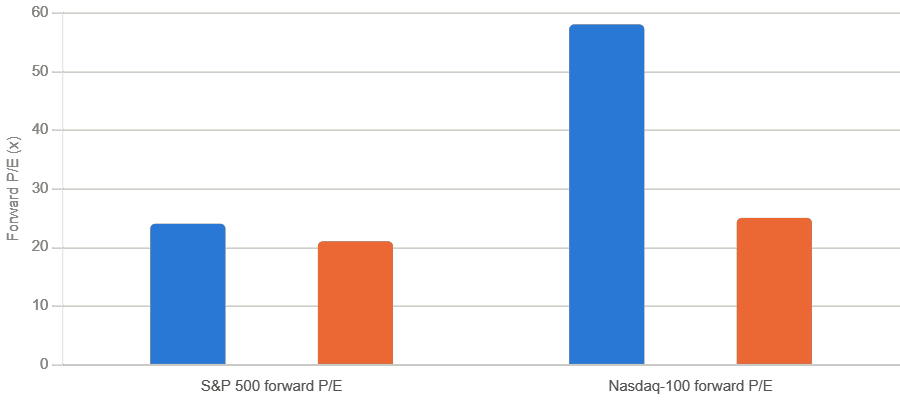
Red - Today
On forward earnings, the story flips relative to price-to-sales: today looks meaningfully cheaper than 2000, not richer. The S&P 500's forward P/E peaked around 24x in March 2000 and sits closer to 20-21x today — a discount to the dot-com top. The gap is far wider for the tech-heavy Nasdaq-100: its forward P/E hit an extreme ~58-60x at the March 2000 peak, versus roughly 25x today.
The reason the two metrics tell different stories comes down to earnings quality. In 2000, a huge share of Nasdaq-100 companies were unprofitable or barely profitable, so the "E" in P/E was thin or negative, inflating the ratio — nearly three-quarters of the Nasdaq index traded above 60x P/E or had no earnings at all. Today, the index's profile is close to the mirror image: about 99.9% of index exposure is profitable, with roughly 70% of that exposure carrying net margins above 25%. So forward P/E looks tame partly because today's mega-cap leaders (Nvidia, Broadcom, Microsoft, etc.) are throwing off real, substantial profits, while price-to-sales looks stretched because investors are also paying up heavily for revenue growth itself, independent of margins.
Worth flagging: forward P/E leans on analyst earnings estimates, which get revised often and could prove too optimistic if AI capex doesn't translate into the projected profit growth — that's the main risk case bears point to.
The Shiller Cape Ratio was created to smooth out Price/Earnings Ratios over 10 years (Below)
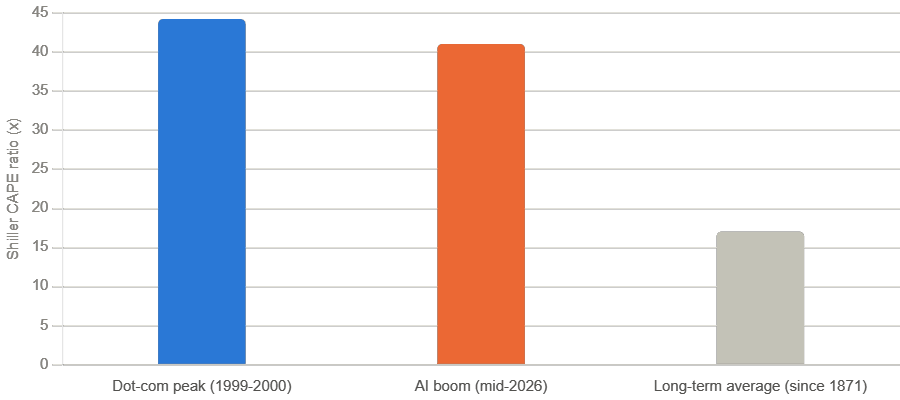
Red – Today
Gray – Long Term Average
This is the metric where the two eras converge almost completely. The Shiller CAPE ratio shows price to earnings ratios relative to 10-year inflation-adjusted average earnings — peaked at 44.2 during the dot-com blow-off of late 1999 into early 2000. As of June 2026, it's sitting around 41.0. Since records began in 1871, those are the only two times the CAPE has ever crossed 40, versus a long-term historical average of roughly 17X.
That convergence is a big part of why the "are we in 1999 again" debate has gotten louder this year. Because CAPE smooths earnings over a full decade, it's less sensitive than a single-year P/E to the fact that today's mega-cap leaders are far more profitable than 2000's dot-coms — it's picking up the sheer level of price paid relative to a decade of earnings power, not just the quality of any one year's profits. Historically, CAPE readings in the 35-40+ range have been followed by weak-to-negative real returns over the subsequent decade, most notably after 2000 (a ~49% S&P 500 drawdown) and, less severely, after 1929.
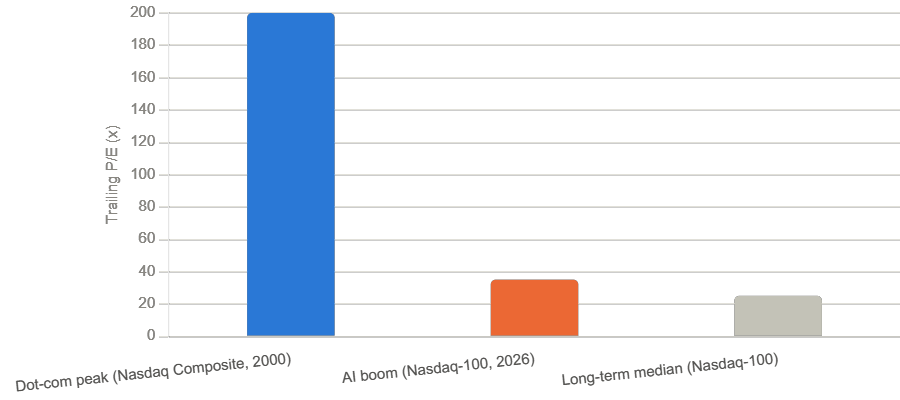
Nasdaq Valuations Comparison 2000 vs. Today
Red – Today
Gray – Long Term Average
This chart shows an incredible difference between the two periods.
At the 2000 peak, the Nasdaq Composite traded at extreme multiples with trailing Price/Earnings ratios of over 200X. Today, Nasdaq-100 forward P/E is roughly 23–25x, with trailing around 30–35x—rich but nowhere near bubble extremes.
Leaders tell a similar story. In 2000, Cisco traded at ~132x forward with modest cash flow; Microsoft at 62x. Today's AI leaders (NVIDIA ~35x forward with ~$60B FCF, Microsoft/Meta/Alphabet in the 20–30x range with tens of billions in FCF) are far more profitable.
Market Concentration: A Risk to the Market Averages, but perhaps not every Stock
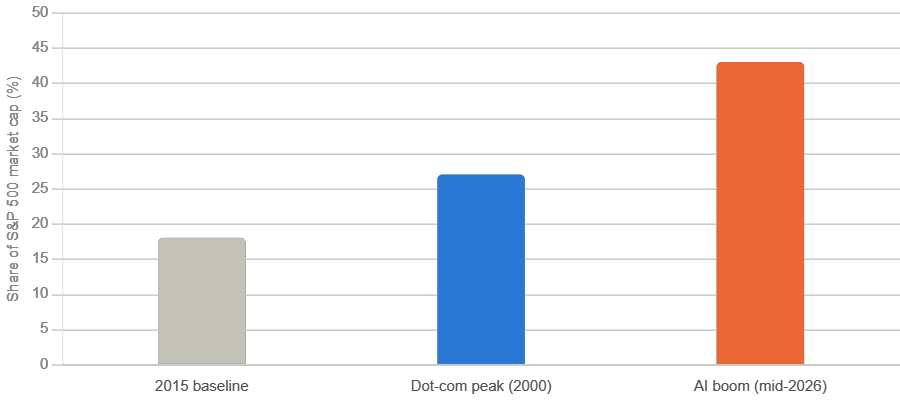
Market concentration is higher today (top-10 stocks ~43% of S&P 500 vs. ~27% in 2000; Mag-7 dominant), which amplifies risks if AI monetization falters.
Earnings Growth and Profitability
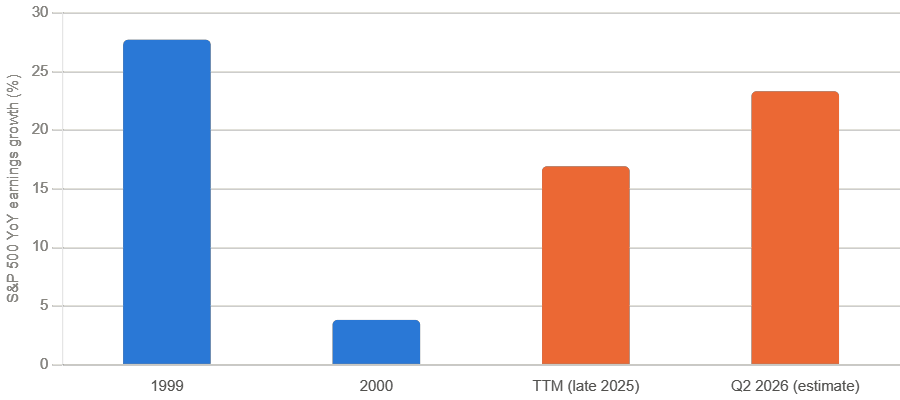
On raw earnings growth, today's AI boom is putting up genuinely stronger, more consistent numbers than the dot-com era did — this is another metric where 2026 looks more solid than 1999-2000.
S&P 500 earnings grew 27.7% in 1999, which sounds impressive until you see what came next: growth collapsed to just 3.8% in 2000, even before the crash really took hold, and then EPS fell over 50% in 2001 as the bubble unwound and profits from unprofitable dot-coms simply evaporated. That volatility — a huge 1999 spike followed by a near-total stall in 2000 — is the signature of earnings that were partly a mirage, propped up by companies whose "growth" was really just capital-raising and spending, not durable profit generation.
S&P 500 earnings growth expectations are robust in 2026 (~18–26% for the year, with Q2 tracking high-20s%), driven by AI and fiscal factors—well above long-term averages.
Unprofitability: In 1999, a huge share of public/tech companies (especially new listings) lost money. Today, ~12% of large-caps and ~32% of small-caps are unprofitable overall – a long-term trend toward fewer but more profitable public firms. AI leaders generate historic profits and FCF, funding their own capex to a degree.
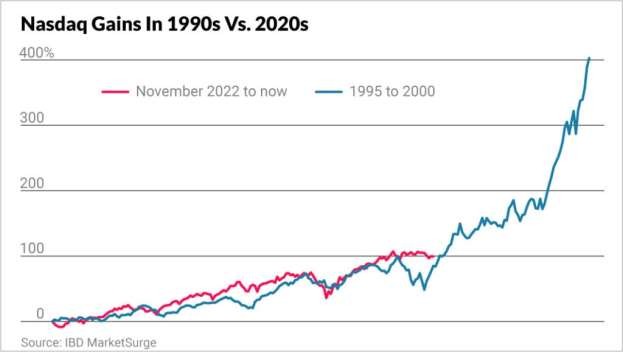
Nasdaq Gains
This chart competently demonstrates a synopsis of the comparison. Though we are several years into a strong Nasdaq rally, it’s nowhere near the gain (and froth) of the 1995 to 2000 Nasdaq, which rose 400% in 5 years, suggesting there could be more room to run.
Other Notable Comparisons and Risks
Capex Intensity: The AI buildout dwarfs the 1990s telecom/internet infrastructure spend in scale (~$300B+ from Big Tech hyperscalers vs. ~$30B then). This creates real economic activity but also risks of overbuild, customer concentration (e.g., NVIDIA's reliance on a few buyers), and potential "earnings bubble" if ROI disappoints.
Broader Context: Lower interest rates today vs. rising rates then; stronger corporate balance sheets and profits now. But higher concentration, fiscal deficits, and geopolitical tensions differ from the late-1990s backdrop.
Balanced View: Neither pure bubble nor risk-free. Fundamentals are stronger today, but high expectations and concentration mean corrections could be sharp if growth disappoints.
Final Thoughts
The AI boom has more substantive underpinnings than the dot-com era's speculative froth, but history shows no paradigm shift escapes valuation resets. If there is one clear clue that 1999/2000 gives us, it’s to follow earnings delivery closely. Diversification, focus on cash-flowing leaders with reasonable multiples, and long-term horizon are prudent. From this examination we would conclude that we are not currently at a March 2000 type bubble peak, risks remain in the areas of similar Price/Sales ratios, Shiller CAPE P/E ratios, and market concentration.
History's clearest lesson from CAPE readings this high isn't that a crash is imminent — 2000's CAPE stayed elevated for months before the top — but that starting valuations this rich have reliably compressed subsequent decade-long returns, regardless of how sound the underlying businesses were. And the concentration risk is real in its own right: an index increasingly dependent on a handful of AI-exposed mega-caps means that where 2000 diversified its excess across hundreds of speculative names, today's market concentrates it in relatively few — which cuts both ways if that small group's growth ever disappoints.