Q3 2024 Market Update

Bet with the Odds Like You’re Playing Hold’em
How would you play a Texas Hold’em hand if: There are 8 players with even chip stacks. You have a king, 7 as your down, dealt cards. Two kings and a 7 show up on the flop giving you a full house (3 kings, pair of 7s). 5 players drop out after the flop, so there are three players left to see the turn and river. The next two cards are a queen and an ace suited. The only hand that can beat you is a straight flush which has a 4% probability with the cards showing. Your odds of winning the hand is 96%. What percentage of your chip stack would you bet?
The narrative from the financial news now for a year has been that odds are, the league of extraordinary bankers (i.e. the Federal Reserve) will engineer a “soft landing.” Goldman Sachs just came out with new odds of a recession occurring at 15%. That was based on the 4 or 5-month lagging indicator of the recent unemployment reading (it would not surprise me if Goldman is playing the other side of that bet). The consensus economist’s odds of a recession now stand at 30%.
Historical Odds
Now let’s examine the historical odds of a soft landing. “Soft Landing” means no recession following an interest rate hiking cycle. There has been only one soft landing in the past 69 years in 1995. Fed Funds interest rates declined after the 1990 recession from 8% to 3%. Then beginning late 1993, rates rose to 6% before moderating a bit to 5% in 1996. No recession. Other than that, all 10 tightening cycles have been followed by a recession, putting the odds at 11:1, or 91% that we will have a recession this go round as well. This puts our odds of a soft landing at 9%, which contrasts greatly from the consensus odds of 70%.
The Yield Curve Inversion Predictive Powers
Possibly even more notable is that 2 to 10-year yield curve inversion that just ended has been long and deep. A yield curve inversion is simply higher market interest rates for short term T-bills than long term T-bonds. This is an oddity because investors would normally expect to be paid more for holding debt for longer periods.
The 2 to 10-year inversion indicator has been amazingly accurate. For example, it did not invert before the 1995 soft landing mentioned above. Since 1950 it predicted 10 recessions and had two false positives in 1966 and 1998. Both of these inversions were brief, and the 1998 inversion was so slight (-.05) it could be ignored, and usually is. The economy slowed dramatically in both false indicator instances. Following the 1966 inversion, GDP slowed from 7% to 2%. So that means the economy slowed significantly 100% of the time after a 2 to 10-year yield curve inversion, 12 for 12. Batting 1000 over the past 74 years.
We’ll save the discussion on why this indicator is so accurate for another time.
So where’s the disconnect between reliable indicators like curve inversions and a consensus of economists? Answer: Other economic indicators. We don’t think it’s difficult to find 50 if you search, from 3 unemployment readings to CPI, to PMI (purchase managers index), trade balances, CCI (consumer confidence index). The initialism list for economic indexes is long. The problem with almost all economic data indicators is that they are rear-view looking. The yield curve is looking around the next bend.
It typically takes 6 to 20 months for a recession to hit after a yield curve inversion ends. There are many reasons for the lag. And the stock market usually starts to decline from 2 to 12 months prior to the recession. The clock is now ticking in this cycle, but it’s anyone’s guess when it might hit. As of this writing the 2-year Treasury sells for 3.96% and the 10-year for 4.10. Averaging past inversion/recession cycles say we will have a recession in around 8 to 10 months and that the stock market will start to decline in 2 to 6. Something like that.
This could be especially dangerous in a market filled with Hopium; an S&P 500 trading at 22 times forward earnings and 26X past years’ earnings. Investors are clearly not expecting a potential recession scenario. And the odds are great that we’re going to have one or at least a major slow-down. Position accordingly.
What’s the True Inflation Rate?
Is Gold Priced in Dollars or Are Dollars Priced in Gold?
FP Nixon may have “temporarily” suspended the gold standard in 1971, but gold is winning the preservation of wealth and purchasing power battle. We are not gold bugs and certainly prefer companies that compound earnings over time, but take a look at the following table showing various currencies vs. gold over the past 20 years. All the major currencies of the world are being rapidly devalued in the (latest) age of central bank fiat money creation.
 Currency                20 Year Gold Price Increase
 US Dollar               530%
 Japanese Yen            751%
 Euro                    625%
 Argentine Peso          206,325%
 Chinese Yuan            436%
 Australian Dollar       584%
 Mexican Peso            530%
 Brazilian Real          400% (10 year)
 British Pound           764%
We are definitely not recommending rushing out to buy gold right now, it is likely due for a correction - same as the market after a big rise over the past year.
But think about that 530% over 20 years in U.S. Dollars. That’s a 9.64% compounded rate of return with no assistance from a dividend. Is that the real rate of inflation? Reflect on that 206,000% devaluation vs. gold in Argentina and think about how you feel about our current deficit spending.
The BLS (Bureau of Labor and Statistics) & FED have changed the way they measure inflation 18 times since 1980, and every change has lowered the official inflation rate that the government disseminates. Economists must justify their jobs. Government gets bigger. The BLS employs over 2500 people. Why use something simple like the money supply when the figures can be obfuscated in complexity by an army of economists and statisticians?
Oh yes, and to answer the above question. We think the dollar (and every other currency) is still priced in gold. This despite a tarnished reputation by such scholars as the primary author of our present-day monetary system John Maynard Keynes, who famously called the gold standard a, “barbarous relic.”
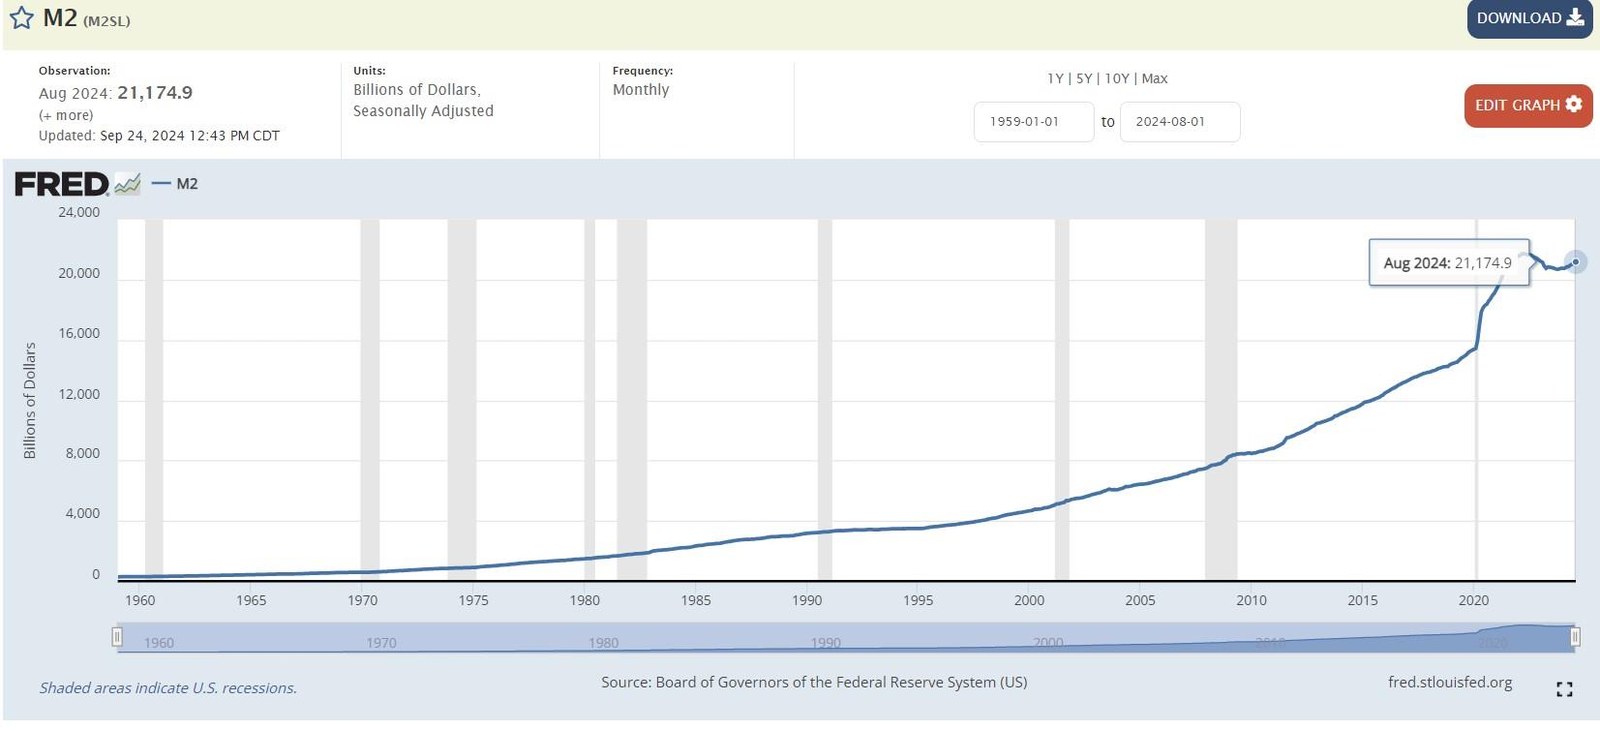
We think even better than gold in estimating true inflation is U.S. money supply growth. Inflation is after all a purely monetary phenomenon. The money supply has increased by nearly 7% a year over the past 50 years. Following is a chart by the Fed which shows the growth of M2 dollars to the $21T deployed today, up from $284B in 1959:

Conclusion
If you want to bet with strong odds regarding whether we will have a recession, bet on us having one, and likely a deep and long one.
Whether one uses gold or the money supply as the inflation proxy, we think investors must realize that the bogey to maintain purchasing power is much higher than previously thought. The inflation tax is likely your largest expense much more than your income taxes - because it taxes all your wealth, not just your income.
How to combat inflation? One of our favorite strategies is to take advantage of corrections and big downturns in the market when they occur – buying quality companies that compound cash flow, and other hard assets like REITS and MLPs. Pricing can quickly get very reasonable. We believe there will be excellent opportunities ahead. Recessions are not bad news if you’re prepared for them.