Q4 2022 Market Update

A Tale of Two Markets
The 2022 Market and Performance
We had our share of mishaps and debacles in our growth and value strategy, Fortunato 1, in 2022. As the saying goes, “you don’t know whose swimming naked until the tide goes out.” The tide showed our investments in Viatris, Ebix, Lincoln Financial, Digital Turbine, and Lending Club to be in the, “very low tide” sea. In the better ocean was H&R Block, Franklin Covey, Elevance Health, Unum, and WP Carey all performed admirably.
Summing the year up by looking at the risk, qualitative and value characteristics of these individual stocks yields a view that it was definitely a risk off year. We were sellers starting in November 2021 as the market was peaking, raising cash as positions hit our price targets. We continued selling and raising cash throughout 2022 as the Federal Reserve Bank continued to raise rates and any rallies were short-lived. Overall, the S&P 500 index dropped 19.4% in 2022 and the tech/growth heavy Nasdaq dropped 33%. Only 5 of the 546 funds tracked by Morningstar (including energy and value funds) had positive returns and they were of the 1 to 2% variety.
The 2023 Market Outlook
In years 1999/2000 I was co-running an ecommerce tech company focused on electronics. It was a fun, fast growing business embracing the new marketing vehicle the Internet presented. The business kept a large cash balance owing to a positive cash flow model as inventory turns were fast, and outgoing payments to OEMs slow. My business partner at the time pounded the table over and again to invest part of our stash in the exciting technology stocks that were doubling and tripling monthly in late 1999. Day trading became a profession. Etrade was the new broker du jour. I succumbed to the pressure and temptation and scattered the money over some of the hot tech “Lucent Technologies” of the day. You know the rest of the story. Over the next few months, our education in buying hot “in” stocks in a scorching out-of-touch market easily outstripped our entire college careers in price.
Comparison 2022-2025 to 2000-2003 Which brings me to a point about the 2000 - 2003 market compared to the 2022 - 2025 market. In 2021 we saw a lot of the same type of buildup in non-sensical companies that were beneficiaries of Covid lockdowns, hot new technologies, biopharma drugs, crypto, meme stocks, real estate prices, – all simply symptoms of the nutso 42% increase in the money supply. The Everything Bubble they called it. At the end of 1999 it was called the Tech Bubble.
In addition to both being bubbles, there are parallels that may be informative to our current situation.
During the 2000 to 2003 bear market there were pockets of value that did just fine and I believe that will be the case in the 2022 to 2025 market. High-P/E large-cap Technology and Communications sectors will likely continue to perform poorly. From its March 10, 2000 intraday top to its October 10, 2002 intraday bottom, QQQ, a fund of the top 100 Nasdaq companies, lost 83.6% of its value. Today’s large cap technology companies are more profitable, so I believe the decline will be smaller. During the 1997 to 2000 runup, the only two sectors to beat the S&P 500 were Technology and Communications. Those sectors were also the only two to beat the S&P during the 2018 to November 2021 runup.Coincidence?
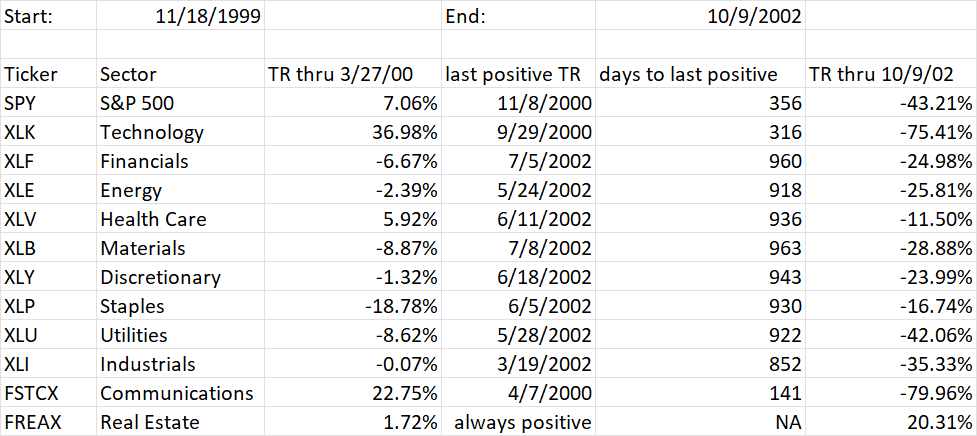
The table below summarizes the returns of each sector through the 2000 to 2003 bear market and shows the last date on which the sector had a positive return relative to 11/18/1999. The non-tech sectors were still positive through the summer of 2002 until the final capitulation stage.
Another important factor is the run-up in stocks before their respective crashes. The Nasdaq partly fell so far and so fast in 2000 because it had surged around 950% over the preceding decade. In the decade to November 2021, the index rose by a still very stout 450%.
The lion's share of the market's losses in 2022 (Nasdaq -33% decline) also occurred in the most overvalued shares. High-P/E large-cap technology shares in 2022, just as in 1973 and 2000, were among the biggest percentage losers. From its March 10, 2000 intraday top to its October 10, 2002 intraday bottom, QQQ, a fund of the top 100 Nasdaq companies, lost 83.6% of its value. We would posit that the total declines in the Nasdaq this go round should be much smaller due to increased profitability of its component companies combined with less of arunup.
As mentioned above, during the 2000-2002 bear market, all sectors outside of tech were positive until the last few months capitulation move. This time around, the Consumer Discretionary sector contains Amazon, and Tesla among others, so this sector may join the other two tech sectors as big losers.
The Real Estate sector never went negative in the 2000-2003 market, however real estate was very pricey going into 2022. There are many tech related REITs such as Data Centers in the sector today, so choosing the right individual REITs and exposure is paramount.
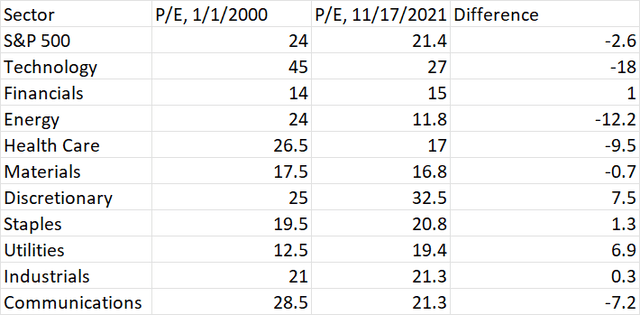
Price/Earnings multiples for various stock sectors were similar for the Tech Bubble of 1999 and Everything Bubble of 2021 (below chart). There are a few adjustments necessary owing to the allocation in Technology, Communications, and Consumer Discretionary sectors as mentioned.
Given the strong similarities to 22 years ago, we would continue to underweight Tech and Communications. Financials, Consumer Staples, and Healthcare look like relative buys due to both current valuation and relative performance during the last tech crash.
Duration
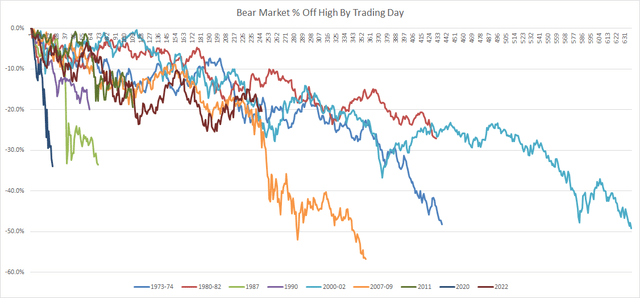
Everyone is asking the same question. How long will the bear market last? The good news is that bear markets are typically short-term affairs, lasting 388 days on average. The bad news is that this bear market has lots of similarities with the longest bear in the past 70 years. The 2000 – 2003 market, lasted from March 2000 – October 2002, 29 months. If the current bear market follows it’s Tech Bubble cousin, we could have many months and more pain coming.
2000-2003 Bear Market. Longest.
1973-1974 Bear Market. 2nd Place.
1980-1982 Bear Market 3rd Place.
2022 - ? Bear Market
Conclusion
Was October 2022 the low for this bear? Will this be the longest bear market in the past 70 years? There is no way to know. But there are plenty of similarities between the Tech Bubble burst and the Everything Bubble unwinding to inform our investing choices going forward. We like the 6-month Treasury, currently yielding 4.8%. We’ve been investing in bank preferred stocks yielding between 6% and 7%. We are tip-toing into of high-quality value stocks with great longterm prospects. Profitable banks in the fintech space that got punished with their unprofitable counterparts is a theme. Some conservative but growing consumer staples and/or healthcare plays make sense to us depending on price/growth. We’re currently staying clear of the industries and types of stocks that were punished severely in the Tech Bubble bust, especially those that could be construed as overvalued.
Best of luck with your investing in 2023 and beyond!
-S Dee
All investments involve risk, including the possible loss of principal.
The comments, opinions and analyses expressed herein are for informational purposes only and should not be considered individual investment advice or recommendations to invest in any security or to adopt any investment strategy. The opinions and analysis are rendered as of publications date and may change without notice. The information provided in this material is not intended as a complete analysis of every material fact regarding any security, country, region, or market.