Q4 2023 Market Update

Defensive Patience Warranted
Magnificent 7 Dominance
2023’s market action was nuts. Bitcoin was the biggest gainer. The Magnificent 7 mega-tech stocks posted average 113% gains and sport P/E ratios in the high 30’s on average. The reasoning for the big move in these stocks is interesting. Apparently, many retail investors feel safe in mega tech without regard to valuation due to their stalwart balance sheets and secular AI tailwinds. So much of the move was due to calls for a recession and a slowing economy as the narrative goes. The Nifty Fifty stocks of the 1970s had a similar reputation, quality and accompanying bloated P/E as well. 48 out of 50 underperformed the market over the next 20 years. Valuations have always mattered over the longterm.
Fed Rate Policy
A few years ago I read somewhere that you could get rid of all the employees and economists of the Federal Reserve and instead use the 9 month T-bill interest rate to guide Fed rate policy because that’s all they do anyway – follow the 9 month rate. Why? The collective global intelligence of the bond market will always trump the Fed’s economic data based decisions. I’ve watched Fed moves over the years and find it to be generally true. The 9-month T-bill rate is currently 5.05%, with the effective Fed Funds rate at 5.33%. No matter what the Fed says with hundreds of charts and thousands of economic data inputs, we can likely expect a 25 basis point cut soon.
Lag Time of Fed Tightening to Slowing GDP
It takes a long time for higher interest rate to work their way through the economy and reveal its effects in the form of higher unemployment and a slower economy. As Milton Friedman concluded (link follows) after thorough research, the lag time varies between 4 and 29 months. We believe that during this rate hike cycle, that time is extended to the late ranges by dramatic and expansive fiscal spending programs and deficits. This is the main topic of today’s market update.
https://www.stlouisfed.org/on-the-economy/2023/oct/what-are-long-variable-lags-monetary-policy
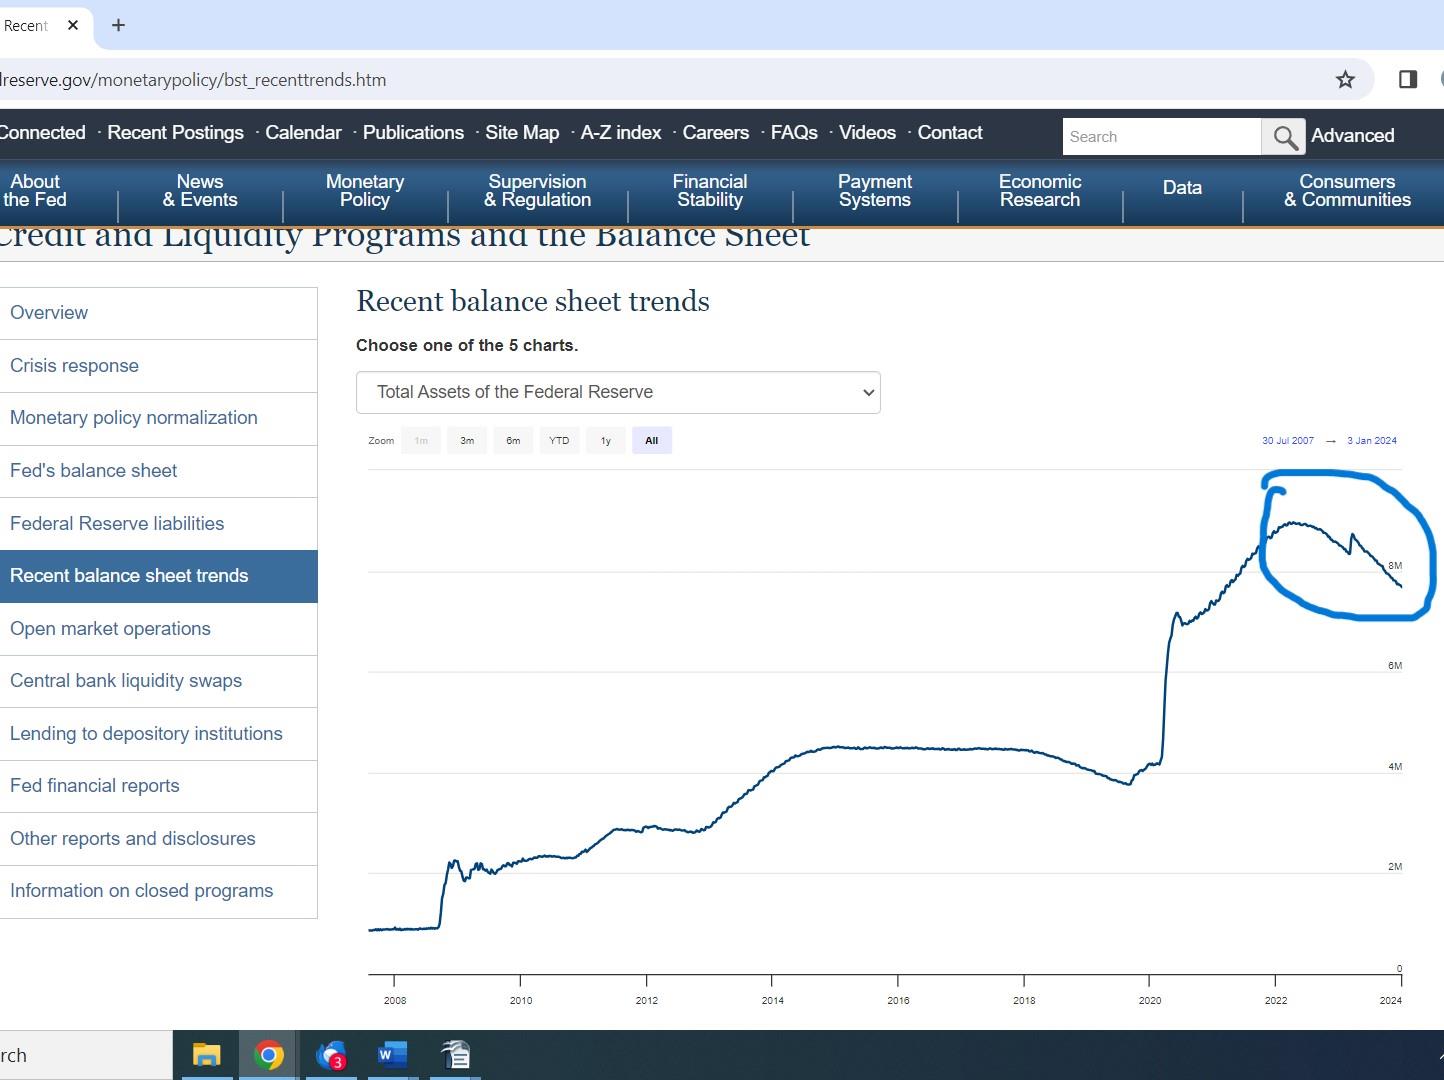
As all are aware, the Federal Reserve Bank has been on a monetary policy tightening tear since January 2022 through raising interest rates and decreasing the Feds balance sheet. They accomplish the latter by allowing treasury bonds held by the central bank to mature without replacing them. This would normally have the effect of decreasing the money supply as the Fed reduces liquidity. The following chart shows the Feds balance sheet decline (circled) since they began quantitative tightening in early 2022.
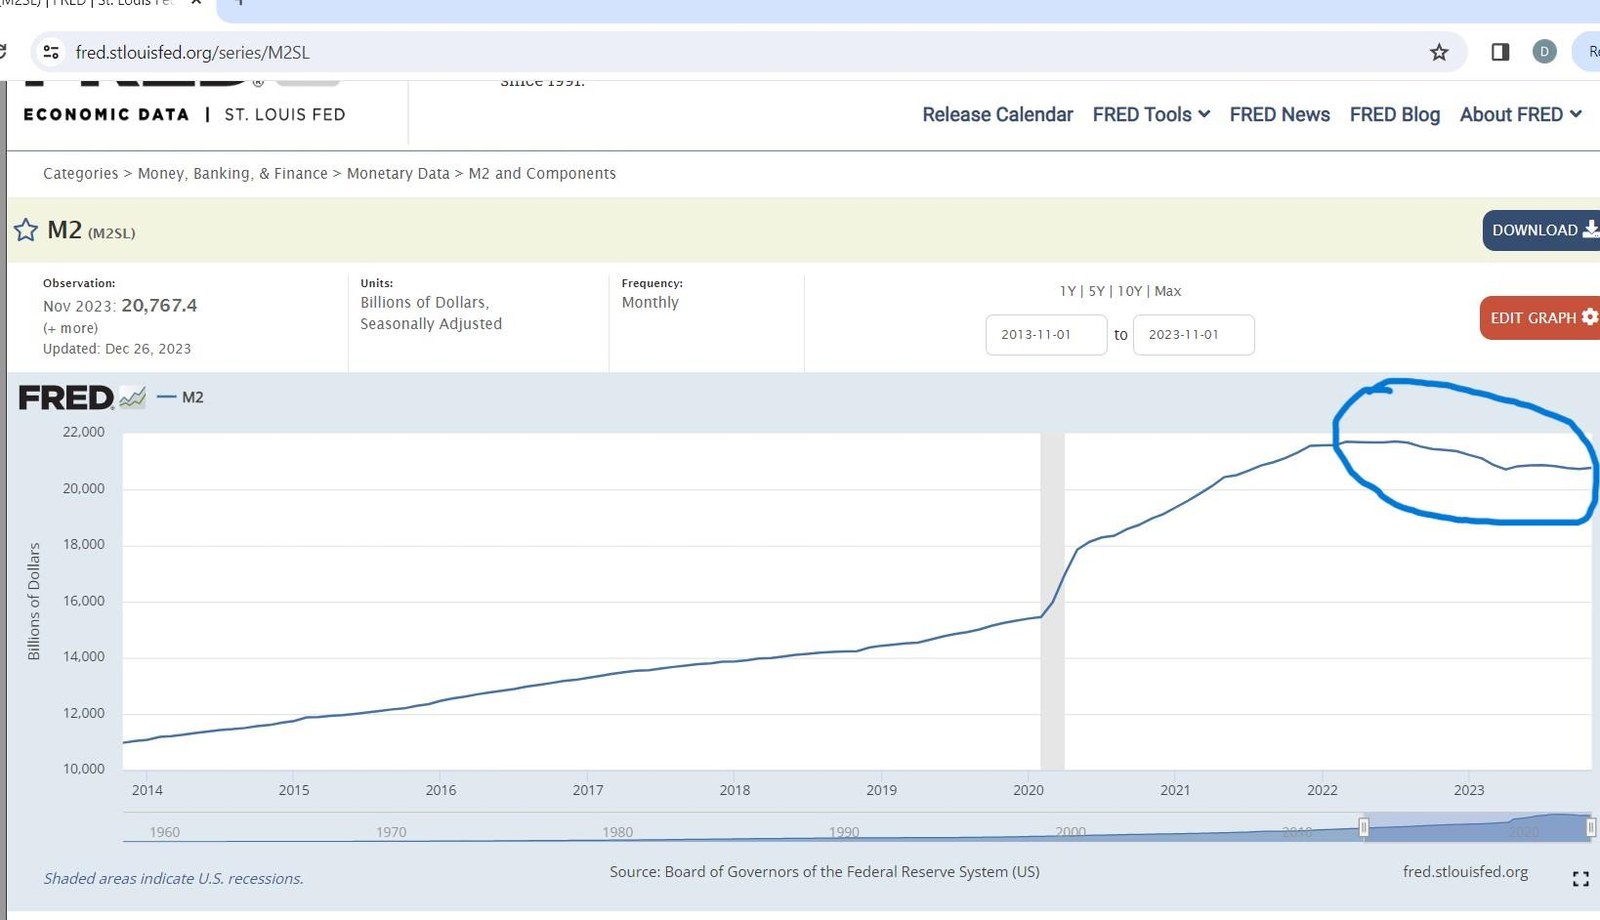
Following is the M2 Money Supply over the past 10 years with the past two circled:
As is evident by the circled areas, the money supply is not declining as much as The Fed’s balance sheet. The latter has declined 7% since early 2022 while the money supply has only dropped 4.1% over the same period. We believe the muted impact on money supply is due to increased and offsetting U.S. FederalDeficits.
U.S. Fiscal Deficit Impacts on GDP
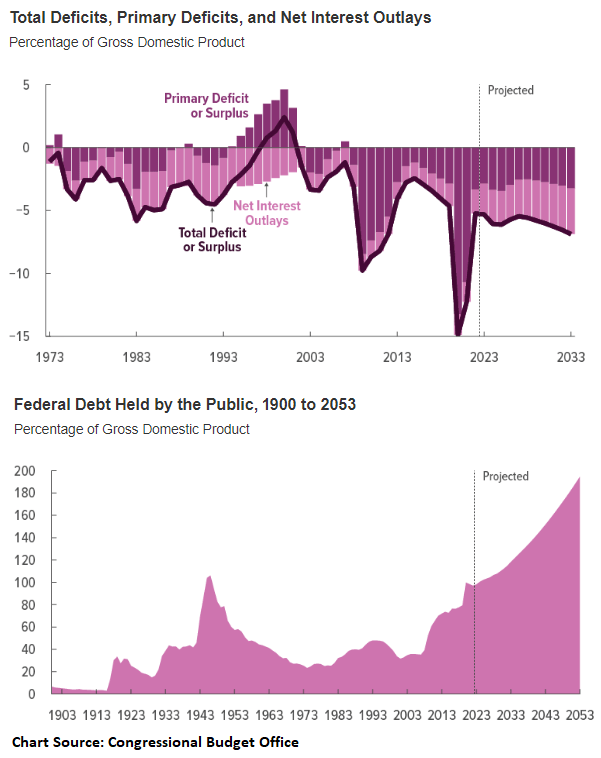
Due to continued spending programs such as the Inflation Reduction Act, the American Rescue Plan Act (coronavirus rescue bill #2), the Infrastructure Investment and Jobs Act, higher interest costs, and higher social security costs, combined with lower government revenues, the Federal Deficit doubled to 7% of GDP in 2023. It’s projected to be between 6.8% and 8% of GDP in 2024. This is extraordinary for peace time spending, and is likely the reason we have not experienced a recession at this point.
Let’s think about a deficit dollar for a moment. A deficit dollar didn’t exist before it was created and is rarely (in the U.S.) put back in the genie bottle by reducing debt. The bonds created to pay for the deficit are reissued as they mature. The money is infused into the economy the moment the government pays a bill, doles out entitlements or gives a tax credit. It’s hugely stimulative.
The mystery of gold’s price action recently:
The fundamentals of gold investing generally state that the most important factor in whether gold rises or falls in the local currency depends on real interest rates (the interest rate minus inflation) being positive or negative. Interest rates rose throughout 2022 and 2023 to a Fed Funds rate of 5.5%. The inflation rate dropped throughout 2023 to a rate of 3.1% in November 2023. So the real interest rate is positive at 2.4%. Right? Yes, right, not a trick question. Yet gold did not sell off and actually increased in price by 9.3% in 2023 to above $2K per ounce. We attribute gold’s price rise to the dramatic rise in deficit spending.
This paragraph from a recent Fitch Ratings Service release for 2024 is instructive:
“In the U.S., elevated rates and a contraction in bank credit will weigh on consumer spending and private investment, resulting in weaker GDP growth of 1.2%, down from 2.4% in 2023. The general government (GG) deficit will remain above 8% of GDP, and the already-high debt burden will continue to rise, approaching 117% of GDP with interest costs reaching over 3% of GDP in 2024.”
Instructive Graphs from the CBO:
Conclusion
Deficit spending is figuring prominently in GDP numbers and stock valuation support and warrants increasing attention. With slowing growth, high valuations relative to earnings, and bullish investor sentiment, we think a defensive posture is best for the start of 2024. In equities, beaten down staples and healthcare, dividend strongholds, high quality value and GARP names. Otherwise, top rated bonds or preferred stocks of medium duration may do well if interest rates drop as predicted.
A small position in oil/gas energy related stocks might be appropriate to hedge what could be a volatile geopolitical year.
Sometimes the bold and opportunistic move is defensive patience. That appears the case with this year’s contrasting set up.
“The essence of investment management is the management of risks, not the management of returns.” -Benjamin Graham
We wish you a fulfilled and prosperous 2024!
All investments involve risk, including the possible loss of principal.
The comments, opinions and analyses expressed herein are for informational purposes only and should not be considered individual investment advice or recommendations to invest in any security or to adopt any investment strategy. The opinions and analysis are rendered as of publications date and may change without notice. The information provided in this material is not intended as a complete analysis of every material fact regarding any security, country, region, or market.
.