Q4 2024 Market Update

Inflation Readings May Hold the Cards in 2025
Market Forecast and Valuation
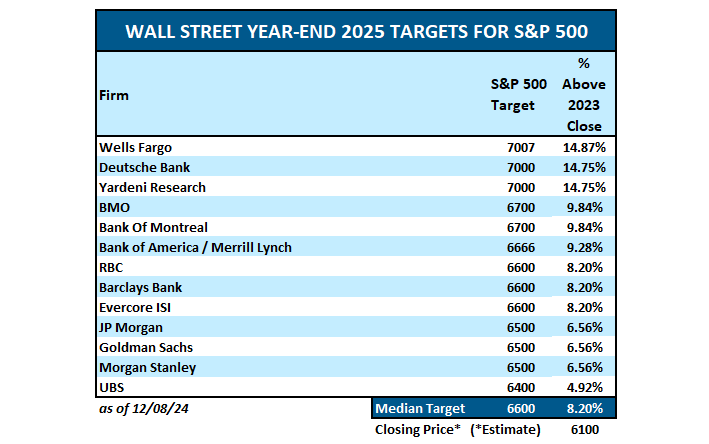
Before we get into the primary topic of inflation, a couple market gauges in charts below. First is the ever-optimistic market forecast projections from top tier Wall Street analysts for 2025. As we have pointed out in the past, these are usually off and by a large margin.
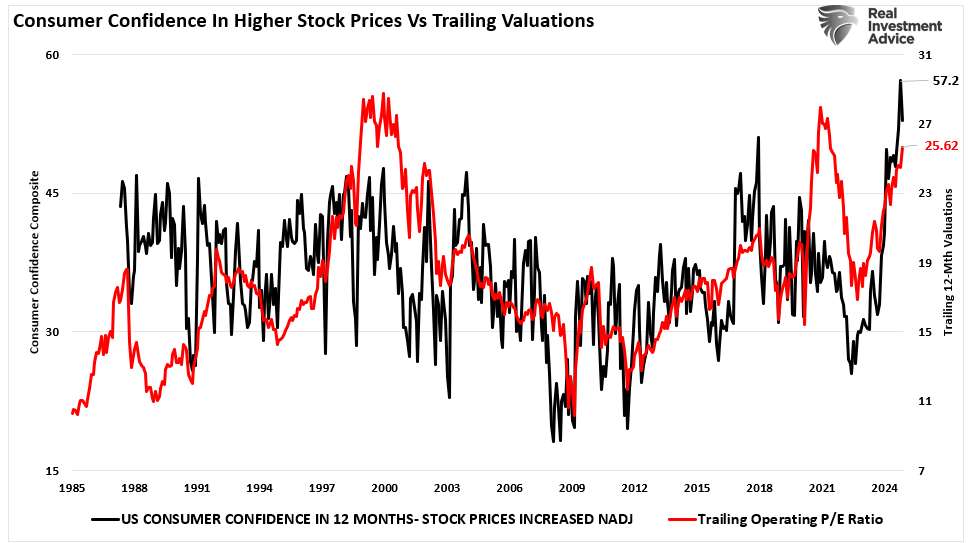
Next, we look at the Consumer Confidence Index for Stock Prices in the chart below. Looks super optimistic even in light of new peak valuations. Notice the spike in expectations when the market started predicting a Trump victory. We view this chart as a negative for future gains.
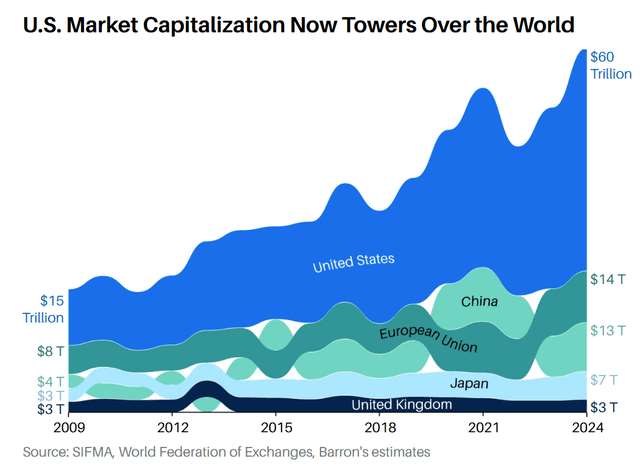
The following chart speaks to the gaining popularity of the U.S. Market:
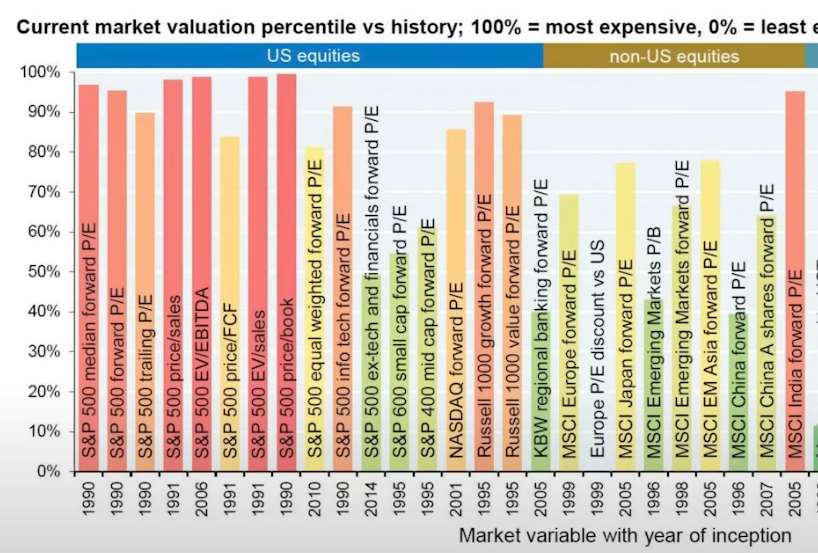
Now we move briefly to valuation. As the chart shows, the S&P 500 (red bars on left) is at one of the highest valuations in history - particularly large cap stocks. That’s based on multiple valuation metrics - S&P 500 forward P/E, EV/EBITDA, EV/Sales, and Price/Book.
In sum we have an expensive S&P 500 with high expectations. Nothing new, but the floor is way down there somewhere, while the ceiling seems just above our heads. The risk profile for the S&P is not in our favor in a 5 to 7 year time frame.’
Buffett’s Cash
We are always interested in what Mr. Buffett is doing. As a student of Buffett, he’s taught me that it’s much more important to watch his actions than his words. Second, he’s usually early with his big moves. Third, he hates to hold cash. He’s partially responsible for coining the term “inflation tax,” when in 2011 he called inflation a, “cruel tax on people.” He stated on another occasion that inflation is a far more devasting tax than anything enacted by the legislature. Therefore, his disdain for holding cash.
Every cycle his actions seemingly get noticed, but discounted, “Oh, he’s lost his touch,” “he’s getting old,” “he doesn’t have a grasp on technology.” Then time proves him right.
Currently, Berkshire is holding $325B in cash/short-term treasuries. Buffett eschews market timing, so there is a simple explanation for the record cash position - he (Berkshire) can’t find anything reasonable to buy.
Inflation
January 15th’s market action is a testimony to the importance of inflation readings this year. The Core CPI (Consumer Price Index) annual rate came in at 3.2% YoY increase, a slight.1% lower than the expected 3.3%. On this news, bonds and stocks rallied robustly. Shelter prices were up 4.6% from a year ago, but this was the smallest one-year gain since January of 2022, thus seen as a big positive. The headline CPI was 2.9% - in line with forecasts.
Inflation looks like the single most important factor to both the bond and stock entering 2025.
Following are a few charts that are important for the year:
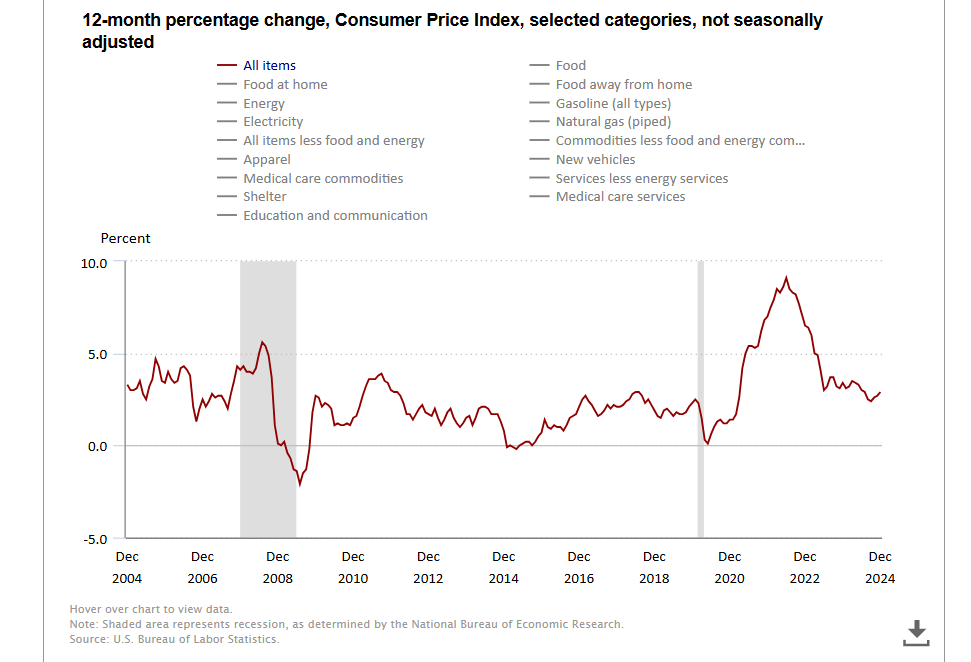
This first chart by the Bureau of Labor and Statistics shows 20 years of CPI inflation rates. The ending rate, December 2024 reading was 2.9%. This chart in 2025 will have an outsized impact on how the stock and bond markets perform. The Fed desires a 2% inflation rate. Any movement to the upside in the CPI and/or PCE inflation indexes will likely spell drawdowns for the markets due to the expectation that the Fed will discontinue rate cuts or even reverse course and start to raise rates. Readings to the downside are supportive of stock and bondprices.
The next chart is Median Home Price since 2014. Shelter costs are the largest component of the CPI (34%), but rather than use Home Prices, the BLS uses “Rent of Primary Residence” and “Owners Equivalent Rent.”
But home prices matter obviously. Rent expenses follow home price costs. The median home price in the U.S. is currently around $420K down slightly from $423K a year ago and down 5% from Q4 2022 as the circled areas in the chart below show. A quick check also shows no material price increases from America’s largest home builders, while margins have declined.
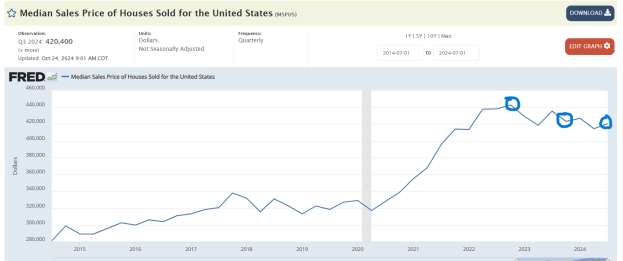
There is a 6 to 12-month lag time for Home Prices to hit CPI and PCE shelter inputs. We’re not currently seeing inflation in house prices nor apartment rents.
Monthly Apartment Rents are decreasing:
Year Median Rent Year-over-Year Change
2022 $1,700 —
2023 $1,594 -6.2%
2024 $1,373 -0.6%
Vehicle prices make up another 8.6% of the CPI. In 2024 prices for new cars were flat while inventories increased. Used cars decreased in price by 6%.
Food price inflation was 2.5% in 2024, following 2.4% in 2023, and 11.4% in 2022.
There could be some slight increases in goods from tariffs. Related goods account for an estimated 7% of the CPI (at most). With the shelter and transportation offset, this should be muted. The narrative we keep hearing from the press about tariffs increasing inflation appear more hype than reality.
The sector with runaway inflation that the U.S. can’t seem to control is health care costs. They’ve been rising consistently at 7 to 9% a year. We’ll see if DOGE can help, but there will be mega resistance.
Conclusion
We have an expensive market with lots of optimism built in. We have a president that likes to see market prices move up. In aggregate, we do not see much inflation on the horizon. This is especially true if there are efforts to decrease the federal budget deficit which is currently projected to be around $1.8T. Deficit spending has been one of the big drivers of market prices over the last few years.
As we wrote in our last market update, the odds of a soft landing are low. Based on current conditions we recommend a very conservative allocation of capital, and extreme caution in high valuation and low quality shares.
All investments involve risk, including the possible loss of principal.
The comments, opinions and analyses expressed herein are for informational purposes only and should not be considered individual investment advice or recommendations to invest in any security or to adopt any investment strategy. The opinions and analysis are rendered as of publications date and may change without notice. The information provided in this material is not intended as a complete analysis of every material fact regarding any security, country, region, or market.
.